Valuation – S&P 500 Next-Twelve-Month P/E Ratio
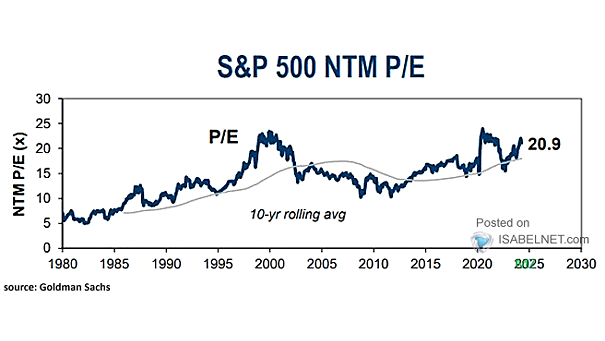
Valuation – S&P 500 Next-Twelve-Month P/E Ratio The S&P 500 NTM P/E ratio is currently at a high level of 20.9, indicating that investors are willing to pay a relatively high price for each dollar…
Valuation – S&P 500 Next-Twelve-Month P/E Ratio The S&P 500 NTM P/E ratio is currently at a high level of 20.9, indicating that investors are willing to pay a relatively high price for each dollar…
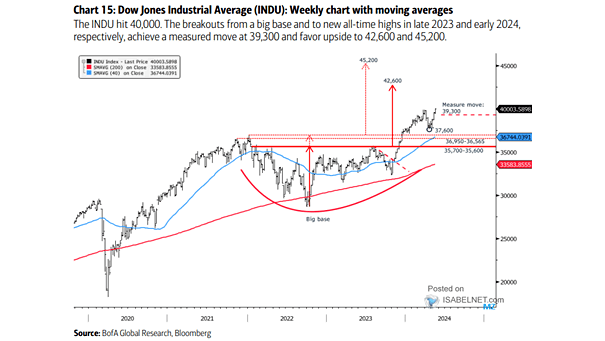
Dow Jones Industrial Average Weekly Chart with Moving Averages The technical analysis suggests that the Dow Jones may potentially surpass the 42,600 mark in the near term, with the possibility of further gains towards the…
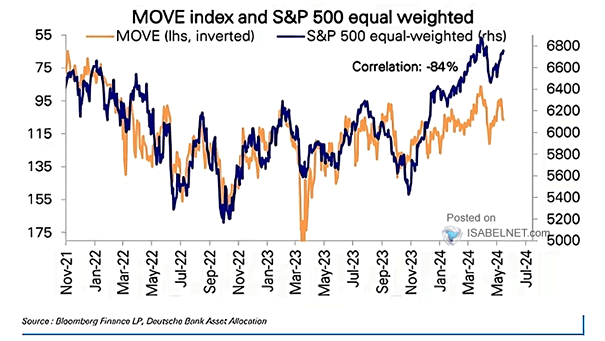
MOVE Index vs. S&P 500 Equal Weighted Assuming bond volatility continues to decline, will the S&P 500 equal weighted index continue to rise? Image: Deutsche Bank Asset Allocation
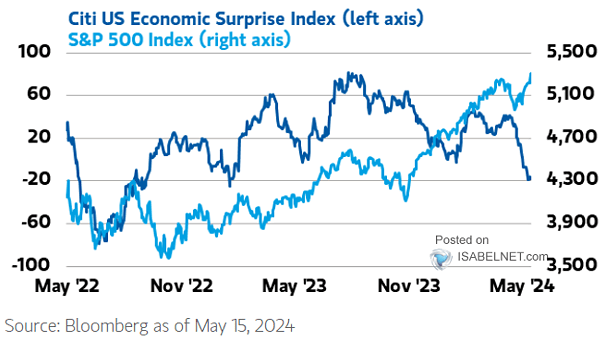
S&P 500 Index vs. U.S. Citi Economic Surprise Index The S&P 500 Index and the U.S. Citi Economic Surprise Index are often closely correlated. But right now, bad news is good news, until it’s not.…
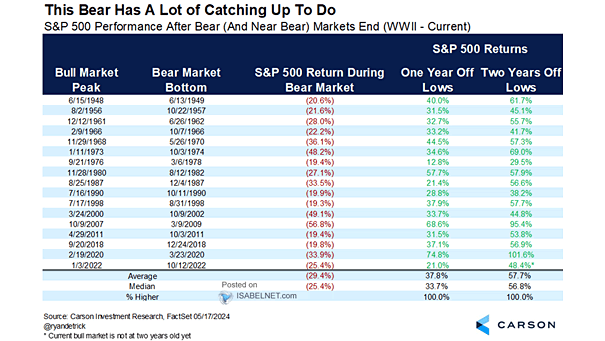
S&P 500 Performance After Bear (and Near Bear) Markets End Historically, the S&P 500 has consistently rebounded and performed strongly after bear markets. It has consistently delivered positive returns in the first and second year…
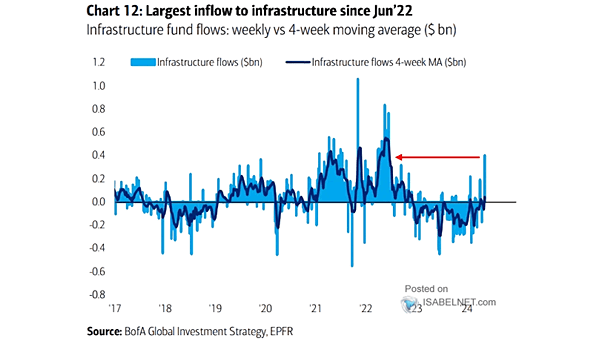
Infrastructure Flows Infrastructure funds have seen their largest inflow since June 2022, signaling a positive trend for investors aiming for long-term returns and portfolio diversification. Image: BofA Global Investment Strategy
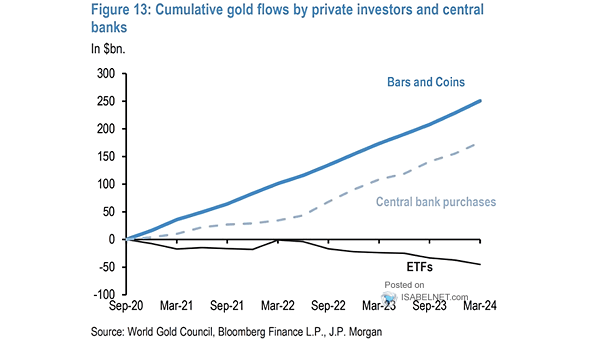
YTD Cumulative Gold Flows Despite the upward trajectory of gold prices, the trend of outflows from gold ETFs has persisted. However, bullion and coin purchases have surpassed gold ETF sales and central bank gold purchases…
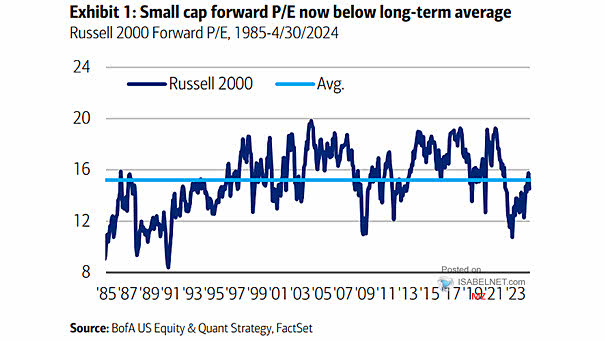
Valuation – Russell 2000 Forward P/E The April sell-off has brought the U.S. small-cap forward P/E ratio back below the historical average, suggesting a potential undervaluation of small-cap stocks and creating buying opportunities for long-term…
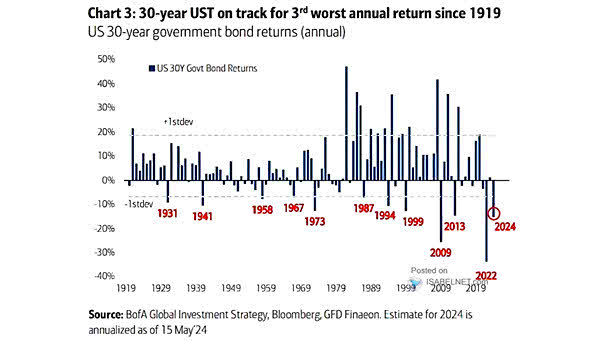
U.S. 30-Year Government Bond Returns The 30-year U.S. Treasury bond is currently experiencing a challenging period in terms of its annual return, as it is on track for the 3rd worst annual return since 1919.…
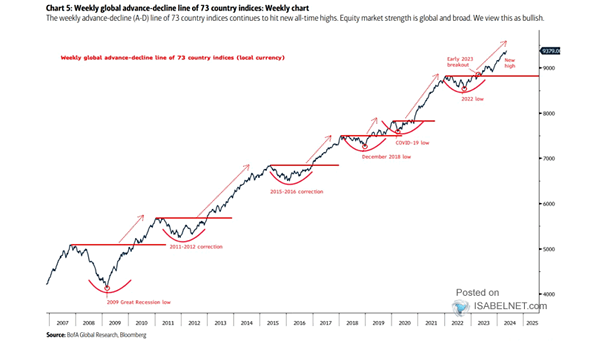
Global Equities – Weekly Global Advance-Decline Line of 73 Country Indices in Local Currencies The bullish weekly global advance-decline of 73 countries indices may positively impact global equities throughout the year, indicating an optimistic outlook…
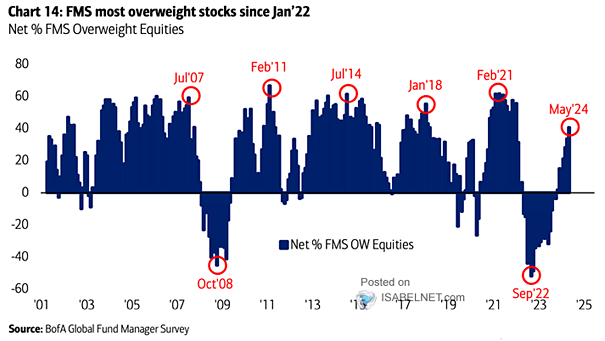
FMS Investors – Net % Say They Are Overweight Equities FMS investors have a greater appetite for risk-taking and a strong inclination toward equity investments. Image: BofA Global Fund Manager Survey