Sectors Positioning (High Frequency)
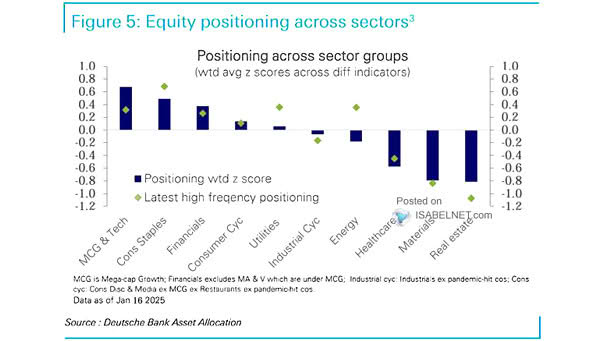
Sectors Positioning (High Frequency) Positioning in mega-cap growth and tech sits near neutral, while cyclicals remain deeply underweight at the 8th percentile. It would not take much positive news to trigger a sharp reversal. Image:…