Tech Flows (Annual Inflows to Tech)
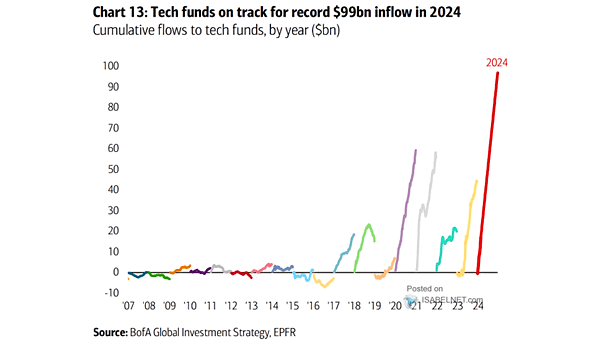
Tech Flows (Annual Inflows to Tech) The significant inflows into tech funds highlight investors’ continued interest in the sector’s growth and innovation potential. Image: BofA Global Investment Strategy
Tech Flows (Annual Inflows to Tech) The significant inflows into tech funds highlight investors’ continued interest in the sector’s growth and innovation potential. Image: BofA Global Investment Strategy
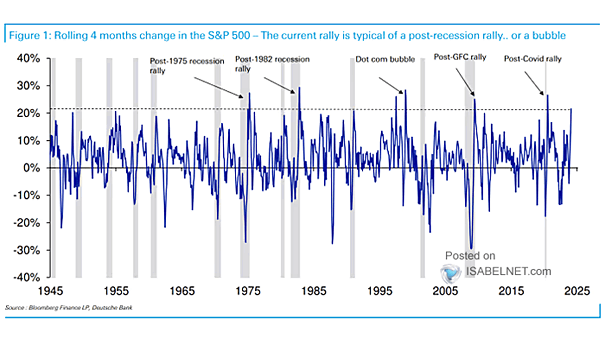
Return – Rolling 4-Month Percentage Change in the S&P 500 Index Does the fast rally in the S&P 500 reflect the characteristics of a bubble, especially when compared to the dot-com bubble? Image: Deutsche Bank
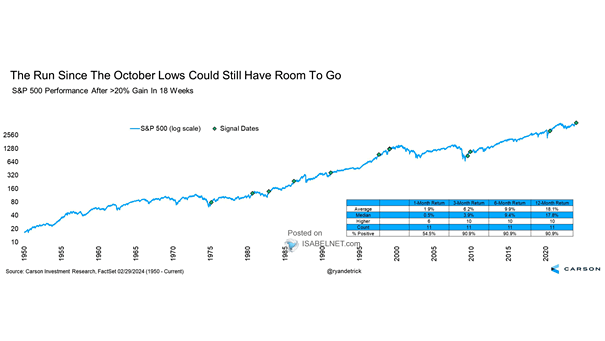
S&P 500 Performance After >20% Gain in 18 Weeks The S&P 500 index has historically shown strong performance after >20% gains in 18 weeks. On average, one year later, the index has increased in value…
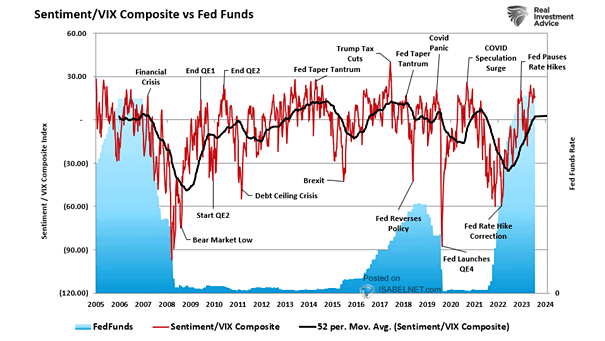
Sentiment/VIX Composite vs. Fed Funds During a rate hiking campaign, bullish sentiment tends to increase initially, but ultimately ends badly. Image: Real Investment Advice
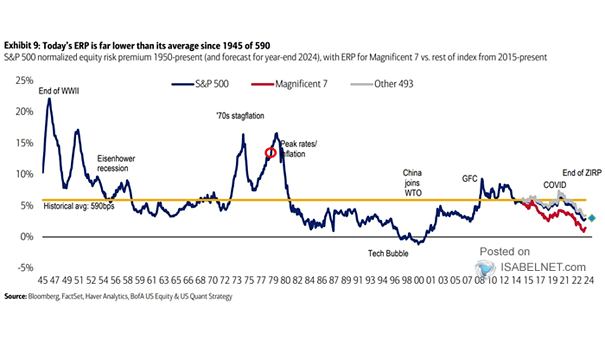
S&P 500 Equity Risk Premium Considering the substantial decline in the equity risk premium, which currently stands well below its historical average, should investors approach U.S. equities with caution? Image: BofA US Equity & Quant…
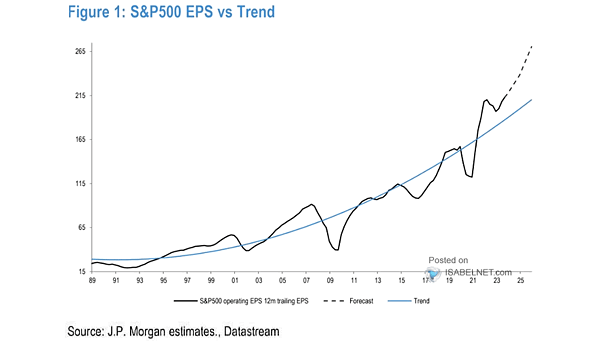
S&P 500 EPS vs. Trend Do consensus EPS estimates for 2024 and 2025 accurately reflect an optimistic outlook, or are they overly optimistic? Image: J.P. Morgan
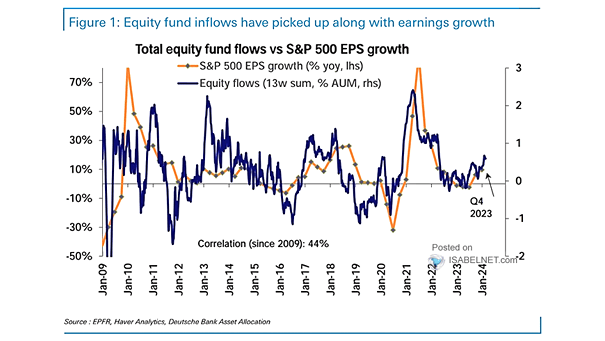
Total Equity Fund Flows vs. S&P 500 EPS Growth Over the past 5 weeks, equity funds have seen inflows of $75 billion. The relationship between equity fund inflows and the growth in earnings of S&P…
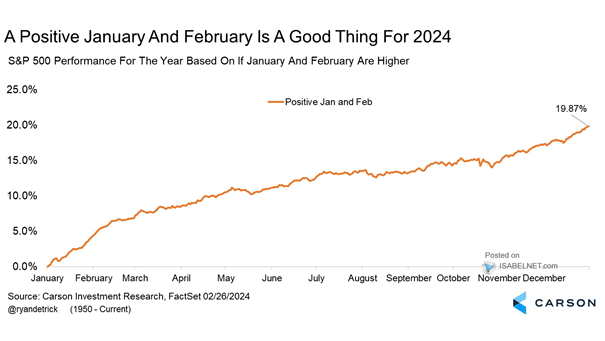
S&P 500 Performance for the Year Based on If January and February Are Higher Since 1950, when both January and February have been positive for the S&P 500, the average annual gain has historically been…
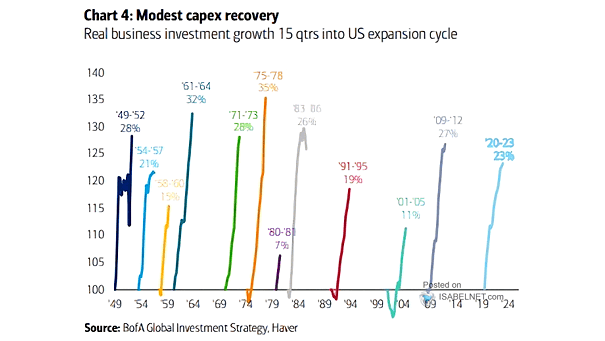
U.S. Real Business Investment While some companies have demonstrated high levels of capital expenditure in the United States, the overall trend remains modest since the 2020 recession. Image: BofA Global Investment Strategy
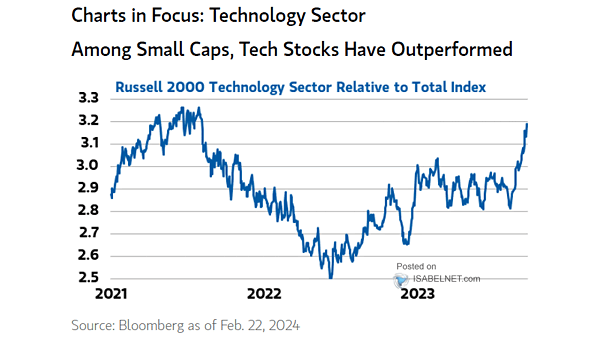
Russell 2000 Technology Sector Relative to Total Index U.S. small-cap technology stocks have exhibited a noteworthy level of outperformance within the universe of U.S. small-cap stocks, which can be attributed to higher growth potential and…
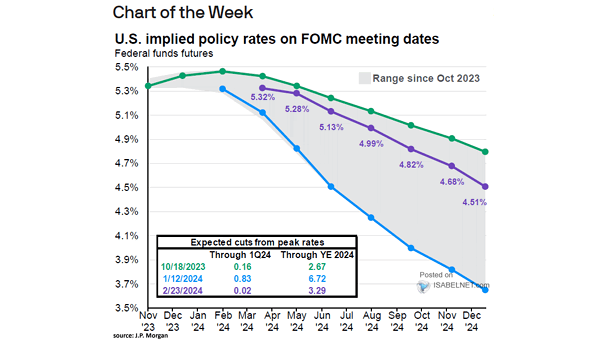
U.S. Implied Policy Rates – Federal Funds Futures Market expectations for Fed policy have swung dramatically over the past few months. Image: J.P. Morgan Asset Management