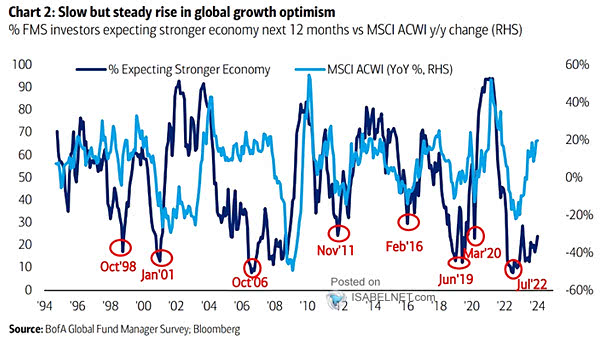
S&P 500 – Duration of 5%+ Pullbacks

S&P 500 – Duration of 5%+ Pullbacks Typically, S&P 500 pullbacks of 5% or more tend to persist for an average of 28 days. Image: Deutsche Bank Asset Allocation

S&P 500 – Magnitude of 5%+ Pullbacks

S&P 500 – Magnitude of 5%+ Pullbacks When pullbacks of 5% or more occur, historical data shows that the S&P 500 has experienced an average decline of -10.2% from its peak. Image: Deutsche Bank Asset…

Average Year for the S&P 500 During a Pre-Election Year

Average Year for the S&P 500 During a Pre-Election Year Historically, the third quarter of pre-election years has been characterized by weakness in the performance of the S&P 500, while the fourth quarter has exhibited…

China Real GDP Growth Forecast

China Real GDP Growth Forecast The downturn in growth in China may be stabilizing. Image: Goldman Sachs Global Investment Research

S&P 500 Valuations vs. 6-Month Forward Returns

S&P 500 Valuations vs. 6-Month Forward Returns Valuations can help frame long-term return expectations, but they rarely say much about what markets will do in the short run. Image: Goldman Sachs Global Investment Research

Consensus U.S. GDP Growth

Consensus U.S. GDP Growth Could the United States experience a significant deceleration in GDP growth in the near future? Image: Deutsche Bank Asset Allocation