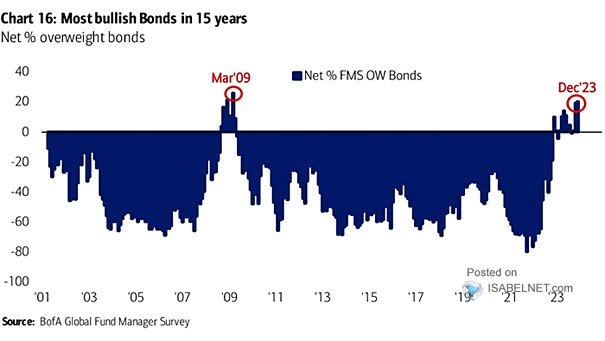
S&P 500 Performance After 7-Day Win Streaks

S&P 500 Performance After 7-Day Win Streaks Historically, 7-day win streaks tend to be bullish for U.S. stocks over the next 12 months. Image: Carson Investment Research

S&P 500 vs. Its Seasonal Pattern

S&P 500 vs. Its Seasonal Pattern While past performance does not guarantee future results, can the U.S. stock market continue to follow its seasonal pattern? Image: Topdown Charts

Median Sector Returns in the Year Before U.S. Election Day

Median Sector Returns in the Year Before U.S. Election Day Given the historical trend of the tech sector underperforming the S&P 500 in the year preceding the U.S. election day, should investors consider underweighting their…

S&P 500 Earnings Revisions Breadth

S&P 500 Earnings Revisions Breadth Earnings revisions breadth for both large and small caps has returned to negative territory, which means that the overall sentiment and expectations for future earnings have worsened. Image: Morgan Stanley…

S&P 500, U.S. 10-Year Yield and U.S. Dollar Index

S&P 500, U.S. 10-Year Yield and U.S. Dollar Index Peaks in the U.S. dollar and U.S. 10-year Treasury yields are seen as essential to catalyze a year-end rally in the S&P 500. Image: BofA Global…

Cash + T-bills % of AUM

Cash + T-bills % of AUM Will cash and T-bills serve as the driving force behind the bull markets of 2024? Image: BofA Global Investment Strategy

U.S. Housing Market – MBA Purchase Index

U.S. Housing Market – MBA Purchase Index Mortgage applications in the U.S. continue to decline due to a combination of high interest rates and elevated home prices, resulting in a 28-year low. Image: The Daily…

S&P 500 Index Valuation vs. Fed Funds Rate

S&P 500 Index Valuation vs. Fed Funds Rate Given that much of the stock market’s progress this year can be attributed to valuation expansion, it is likely that U.S. stocks will eventually experience a correction…

S&P 500 6-Month Seasonality

S&P 500 6-Month Seasonality November through April is considered the optimal 6-month period for the S&P 500, as historical analysis suggests stronger performance compared to the other six months of the year. Image: BofA Global…