Fed Funds Rate and Dow Jones Index
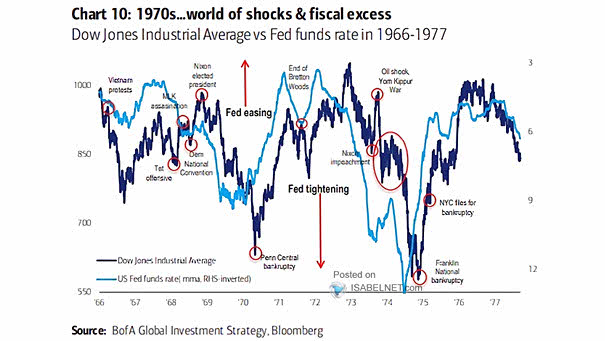
Fed Funds Rate and Dow Jones Index In the same way as it was in the 1970s, it’s all about the Federal Reserve. Image: BofA Global Investment Strategy
Fed Funds Rate and Dow Jones Index In the same way as it was in the 1970s, it’s all about the Federal Reserve. Image: BofA Global Investment Strategy
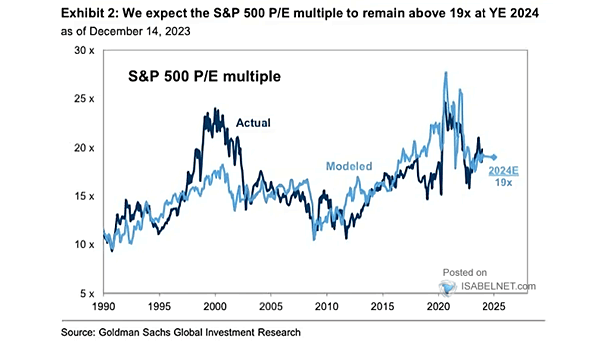
Valuation – S&P 500 Price/Earnings Ratio The S&P 500 P/E multiple is expected to remain above the average level observed since 1990, indicating investors’ willingness to pay more for earnings, possibly due to optimism about…
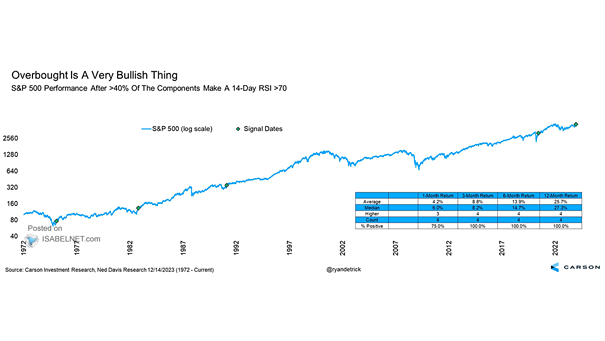
S&P 500 Performance After >40% of the Components Make a 14-Day RSI >70 When more than 40% of S&P 500 components hit a 14-day RSI above 70, the S&P 500 index tends to perform strongly…
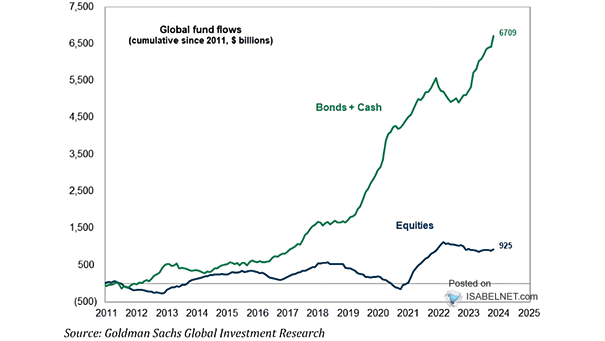
Cumulative Global Fund Flows Investors are showing less enthusiasm for equity funds. In contrast, flows into global bond and cash funds remain very strong, reflecting a prevailing investor sentiment towards these two asset classes. Image:…
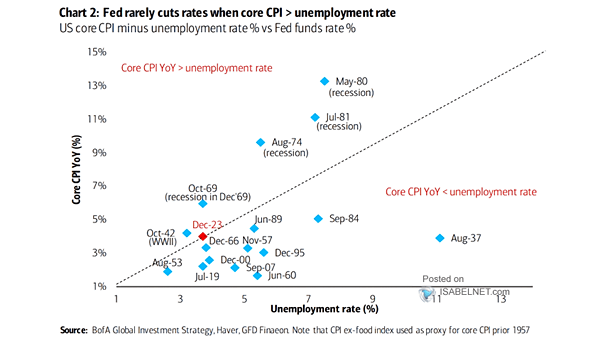
U.S. Core CPI Minus Unemployement Rate % vs. Fed Funds Rate The Fed rarely cuts rates when core CPI exceeds the unemployment rate, reflecting the central bank’s concern about potential inflationary pressures in the economy…
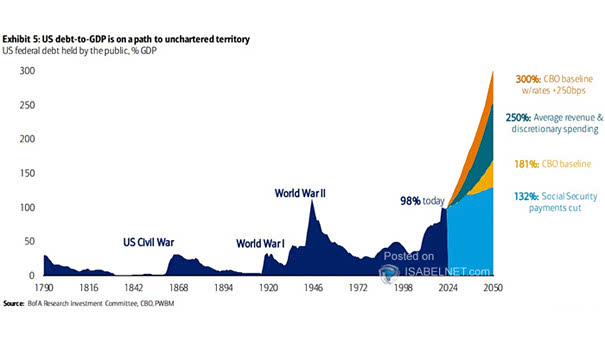
U.S. Federal Debt Held by the Public The projected ballooning of the U.S. federal debt by 2050 could have negative impacts on the U.S. economy, with more interest payments, limited resources, and potential constraints on…
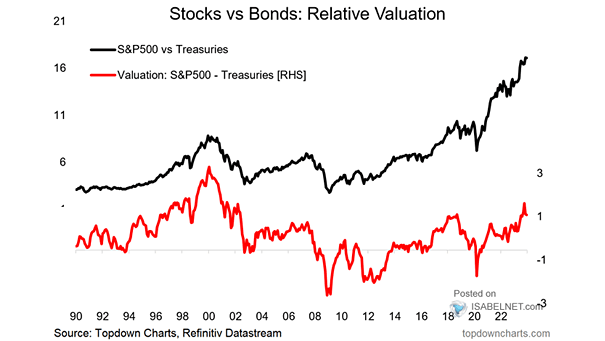
Stocks vs. Bonds – Relative Allocations U.S. stocks are relatively expensive compared to bonds. Are investors too aggressively positioned in U.S. stocks relative to bonds? Image: Topdown Charts
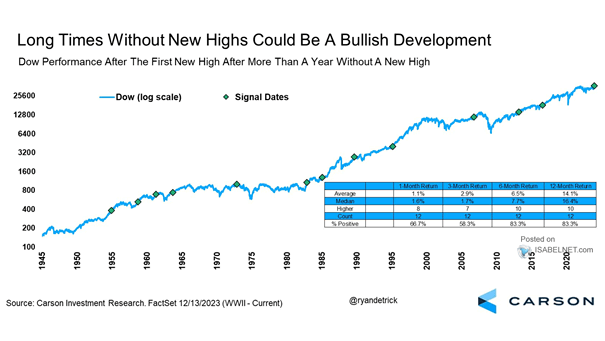
Dow Jones Performance After the First New High After More Than a Year Without a New High Historically, when the Dow Jones has reached new highs following a period of more than a year without…
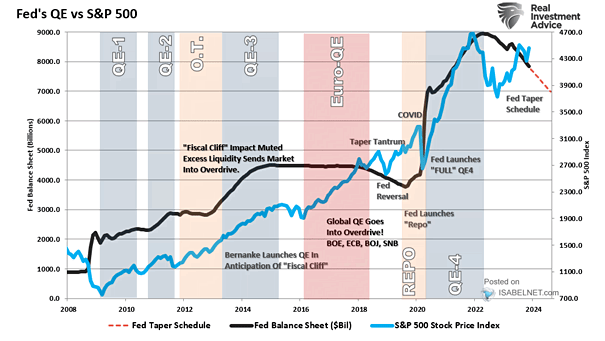
Fed Balance Sheet Expansion/Contraction vs. S&P 500 The contraction of the Fed’s balance sheet tends to be a headwind for the S&P 500, as reduced liquidity in the financial system may have negative implications for…
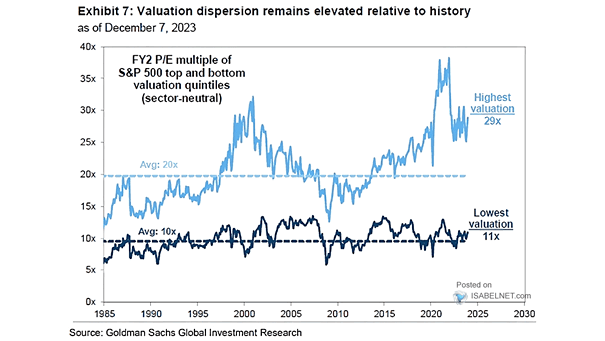
FY2 P/E Multiple of S&P 500 Top and Bottom Valuation Quintiles The valuation gap between high and low valuation U.S. stocks remains elevated, presenting potential opportunities for value investors. Image: Goldman Sachs Global Investment Research
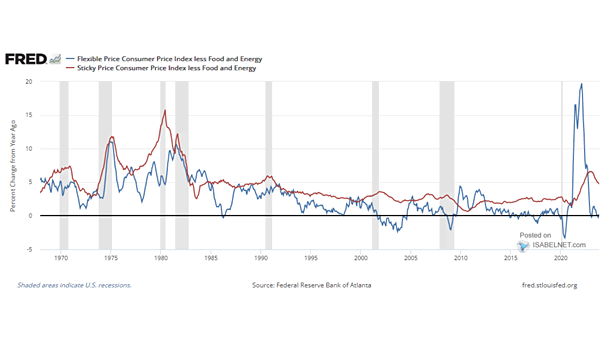
Flexible and Sticky Inflation Flexible inflation (core goods) has fallen significantly and sticky inflation (core services) is still declining, which is good news as it suggests a moderation in the inflation rate. Image: Federal Reserve…