AAII Bulls Minus Bears and S&P 500 Returns
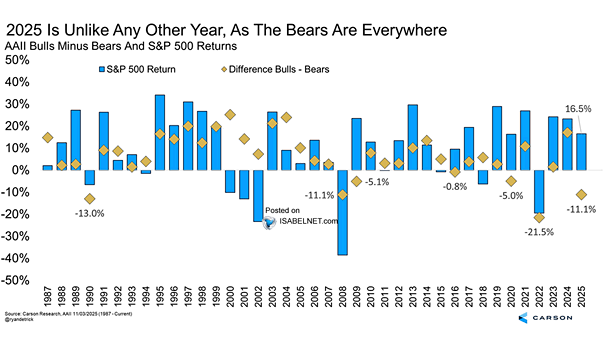
AAII Bulls Minus Bears and S&P 500 Returns The S&P 500 trades near record highs, up more than 10% year to date, but US retail sentiment refuses to follow. The AAII bull-bear spread remains stuck…
AAII Bulls Minus Bears and S&P 500 Returns The S&P 500 trades near record highs, up more than 10% year to date, but US retail sentiment refuses to follow. The AAII bull-bear spread remains stuck…
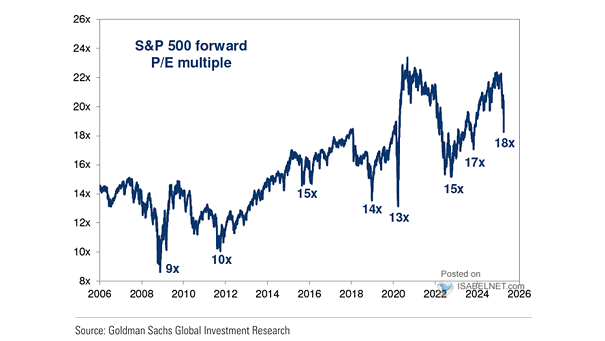
Valuation – S&P 500 Forward P/E Multiple Since October 2025, the S&P 500’s forward P/E has eased from 23 to 21, largely on the back of stronger forward earnings estimates. Valuations look less stretched than…
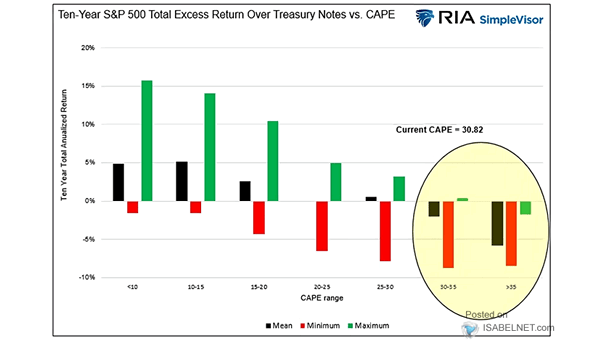
S&P 500 Cyclically-Adjusted P/E Ratio (CAPE) vs. S&P 500 Return on Equity (ROE) Record profitability is helping justify elevated S&P 500 valuations, with trailing four-quarter ROE at 22%, a historic high. But if margins come…
Potential Indicators of Exuberance Relative to History AI bubble worries are creeping back into the narrative. Investors are more bullish than usual, but sentiment points to late-cycle exuberance rather than a full-blown bubble. Image: Goldman…
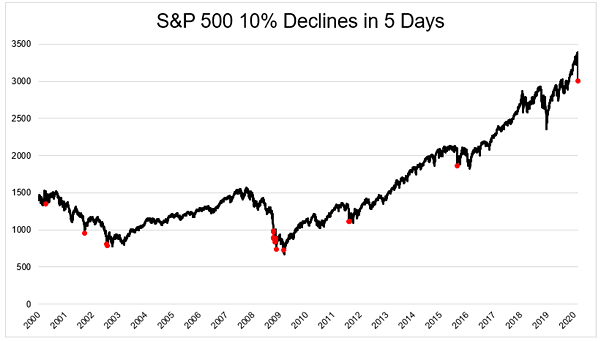
S&P 500 Peak-To-Trough Decline After Major Issuance Booms Major U.S. equity issuance booms tend to follow late-cycle optimism. On its own, that is more a caution flag than a sell signal. It carries more weight…
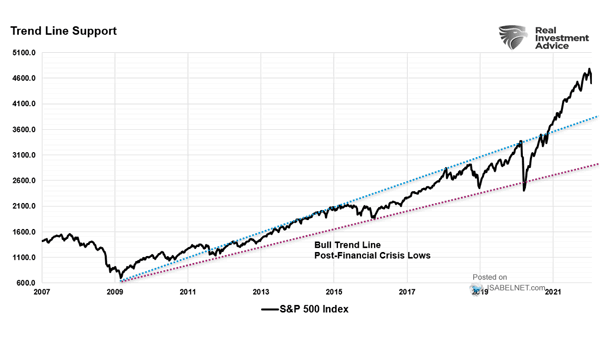
S&P 500 Index and Trend Channels What we are seeing in U.S. stocks looks more like consolidation than the start of a lasting downturn, with investors digesting recent gains and adjusting their outlook. Image: J.P.…
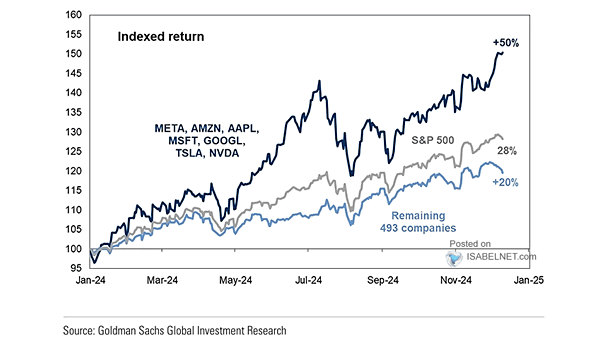
Indexed Returns of AI-Related Portfolios vs. Equal-Weight S&P 500 Infrastructure has driven the AI rally, with chip giants, data center builders and cloud platforms capturing the upside while software and productivity names fall behind. Image:…
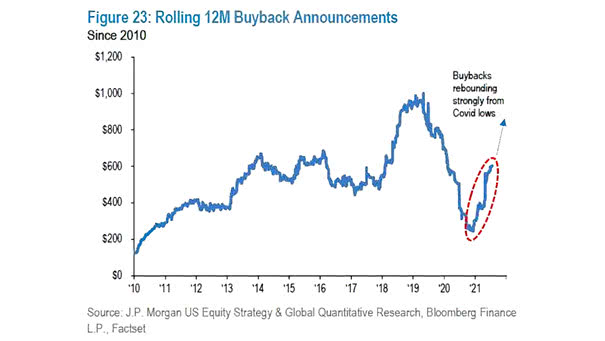
Global Share Buyback Announcements Global share buybacks show no signs of slowing, as steady earnings keep the pipeline full. For shareholders, that’s a supportive backdrop, and unless profits falter, the momentum looks durable. Image: J.P.…
Capex as % of Cash Flow from Operations All signs point to hyperscalers reinvesting nearly all operating cash flow into capex, a tailwind for infrastructure suppliers but a potential headwind for equity returns if free…
U.S. Tech Media Telecom Valuations vs. ROE Investors are still willing to pay a premium for U.S. tech, media, and telecom stocks, and with robust returns on equity, those valuations look broadly justified. Image: Goldman…
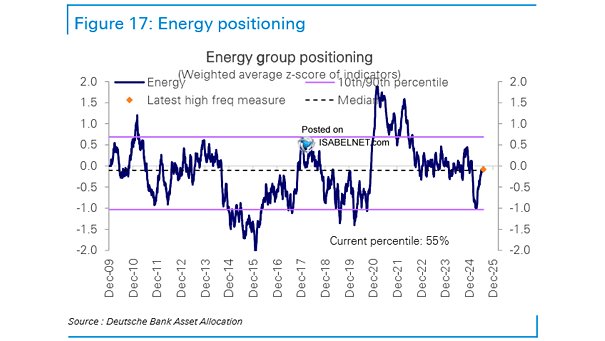
Energy Group Positioning Energy sits in the 91st percentile on positioning, firmly in overweight territory. With strong earnings momentum largely priced in, the sector looks exposed if oil prices soften. Image: Deutsche Bank Asset Allocation