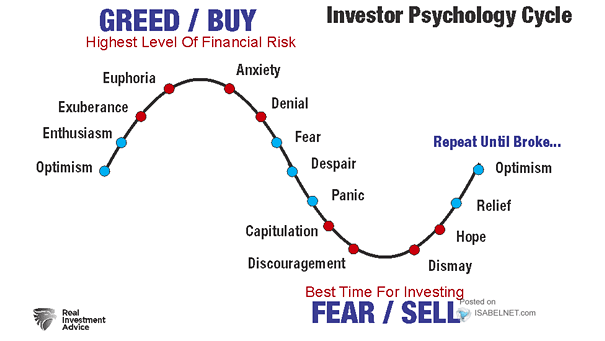
Cash + T-bills % of AUM
Cash + T-bills % of AUM Will cash and T-bills serve as the driving force behind the bull markets of 2024? Image: BofA Global Investment Strategy
U.S. vs Emerging Market Equities Relative Price Performance Will the secular outperformance of U.S. equities vs. emerging market equities come to an end in 2024? Image: BofA Global Investment Strategy
U.S. Housing Market – MBA Purchase Index Mortgage applications in the U.S. continue to decline due to a combination of high interest rates and elevated home prices, resulting in a 28-year low. Image: The Daily…
S&P 500 Index Valuation vs. Fed Funds Rate Given that much of the stock market’s progress this year can be attributed to valuation expansion, it is likely that U.S. stocks will eventually experience a correction…
S&P 500 6-Month Seasonality November through April is considered the optimal 6-month period for the S&P 500, as historical analysis suggests stronger performance compared to the other six months of the year. Image: BofA Global…
S&P 500 Performance When Down In October, But Still Positive YTD When the S&P 500 declines in October but maintains a positive performance since the beginning of the year, historical trends suggest that the last…
10-Year U.S. Treasury Yield Less CPI Given investors’ historic tendency to demand a 200 basis point premium over inflation rates, could rates rise further? Image: Morgan Stanley Wealth Management
Importance of Macro Driver in Explaining Returns Higher real 10-year UST yields can potentially lead to a decrease in U.S. stock returns, but other factors should also be considered. Image: Goldman Sachs Global Investment Research
U.S. Equity Risk Premium – Long-Term View Should investors approach U.S. equities with caution due to the significant decline in the equity risk premium, which stands well below its historical average? Image: Topdown Charts
S&P 500 When Up 10% or More at the End of June The sell-off in U.S. stocks may not imply a long-lasting bearish period, but rather a temporary dip that could reverse in late October,…
S&P 500 Performance After a Year of No Record Highs From a historical perspective, the absence of a record high in the S&P 500 Index since the start of the year could indicate the possibility…