
GAAP Earnings vs. PPI to CPI Spread
GAAP Earnings vs. PPI to CPI Spread The PPI to CPI spread suggests that there could be ongoing pressure on earnings. Image: Real Investment Advice
GAAP Earnings vs. PPI to CPI Spread The PPI to CPI spread suggests that there could be ongoing pressure on earnings. Image: Real Investment Advice

ISM Manufacturing New Orders vs. U.S. 12-Month Trailing EPS Growth ISM Manufacturing New Orders tend to lead U.S. 12-month trailing EPS growth by 3 months. Image: Morgan Stanley Wealth Management
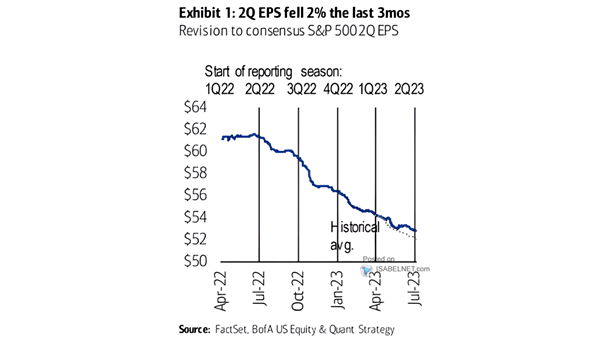
Revision to Consensus S&P 500 3Q EPS 2Q EPS fell by just 2% over the last 3 months, compared to the usual 4%. Image: BofA US Equity & Quant Strategy
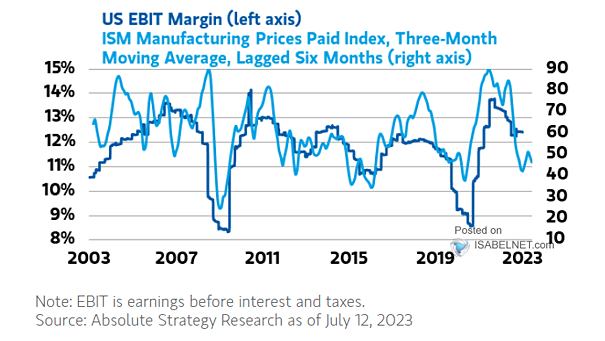
U.S. EBIT Margin vs. ISM Manufacturing Prices Paid Index Profit margins are rarely sustained by falling inflation. Image: Morgan Stanley Wealth Management
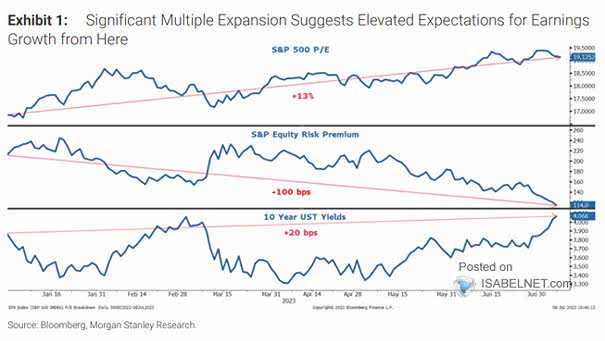
Valuation – S&P 500 P/E, S&P Equity Risk Premium and U.S. 10-Year Treasury Yields Significant multiple expansion in the absence of a corresponding increase in earnings growth can generally be a warning sign that U.S.…
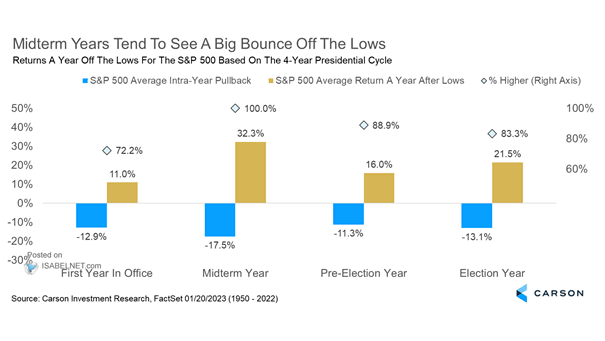
Returns a Year Off the Lows for the S&P 500 Index Based on the 4-Year Presidential Cycle Historically, U.S. stocks have shown an average increase of 32.3% a year after a midterm year low. Image:…
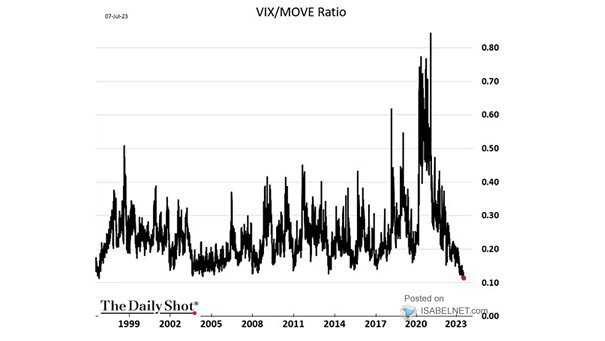
Volatility – VIX/MOVE Ratio The VIX/MOVE ratio is still falling. Image: The Daily Shot
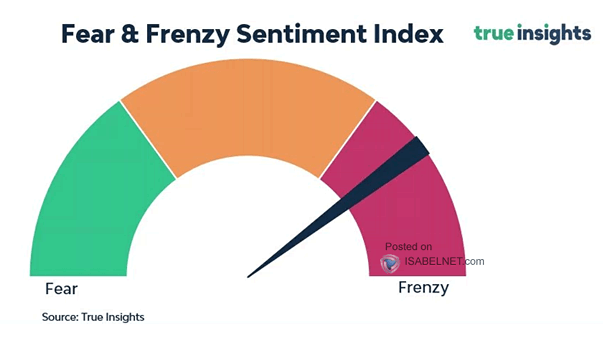
Investor Sentiment – Fear & Frenzy Index Investor sentiment remains overly optimistic. Is it time to be cautious? Image: True Insights
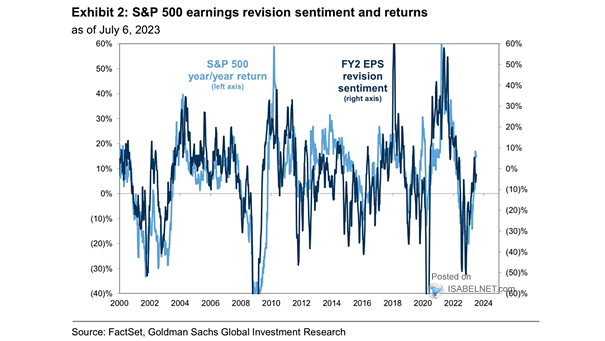
S&P 500 Earnings Revision Sentiment and Returns There is generally a good correlation between S&P 500 earnings revision sentiment and returns. Image: Goldman Sachs Global Investment Research
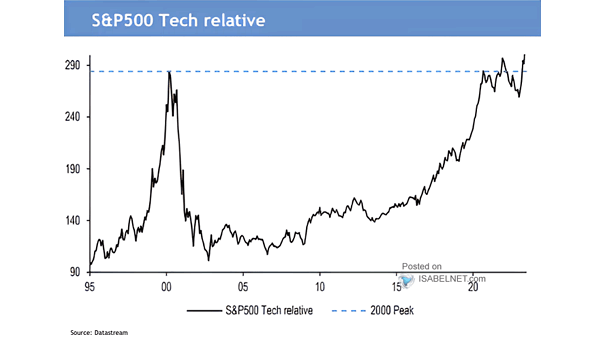
Performance – S&P 500 Tech Relative Can investors expect the outperformance of tech stocks relative to the S&P 500 to continue? Image: J.P. Morgan
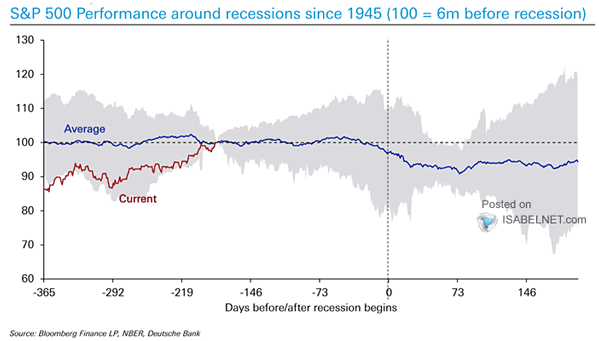
S&P 500 Performance Around Recessions In the year preceding a U.S. recession, the average performance of the S&P 500 is historically flat. Image: Deutsche Bank