Equal-Weight S&P 500 (RSP) Relative to Cap-Weight S&P 500 (SPY)
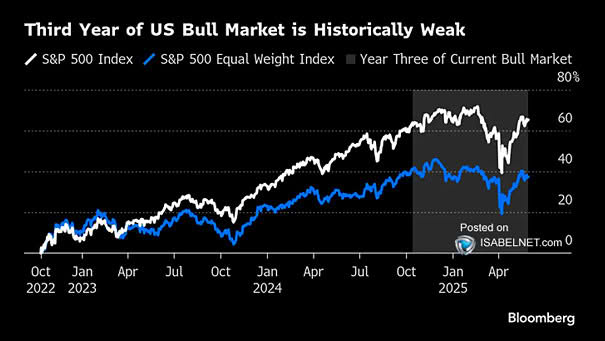
Equal-Weight S&P 500 (RSP) Relative to Cap-Weight S&P 500 (SPY) As megacap leadership fades, market breadth is improving. This isn’t an outflow from equities. It’s just a rotation out of concentration. Image: Real Investment Advice