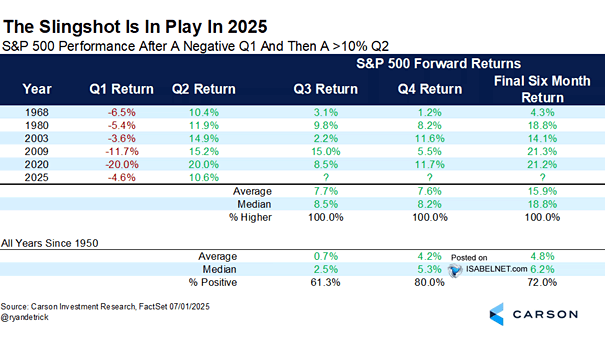
S&P 500 Quarterly Net Profit Margin (Ex. Financials & Energy)

S&P 500 Quarterly Net Profit Margin (Ex. Financials & Energy) Consensus forecasts indicate that S&P 500 profit margins will remain near record highs in 2025, supported by steady earnings growth and strong economic expansion. Image:…

ISM Manufacturing Index vs. S&P 500 Index

ISM Manufacturing Index vs. S&P 500 Index The U.S. ISM Manufacturing Index in June stands at 49.0%, above the consensus forecast of 48.8%, which is indicative of a contraction in the manufacturing sector. This chart…

Equity Sector Flows

Equity Sector Flows Strong IT spending and AI innovation are driving robust inflows and sustained investor enthusiasm, which in turn support the technology sector’s resilience and growth in 2025. Image: J.P. Morgan Equity Derivatives Strategy

Different Market Sentiment Indicators

Different Market Sentiment Indicators The prevailing market sentiment is marked by an equilibrium between optimism and caution, with no decisive dominance of bullish or bearish perspectives at present. Image: Goldman Sachs Global Investment Research

New York Fed GDP Nowcast

New York Fed GDP Nowcast The New York Fed’s Q3 2025 GDP Nowcast was revised downward to 1.78% from 1.92% last week, suggesting slower economic growth ahead. Image: Federal Reserve Bank of New York Click…

Average Annual Inflation of 152 Countries Since 1971

Average Annual Inflation of 152 Countries Since 1971 The post-Bretton Woods monetary system features greater inflation variability and generally higher average inflation, making it difficult for countries to keep inflation consistently below 2% over the…

S&P 500 / WTI Spot Price, Detrended

S&P 500 / WTI Spot Price, Detrended The roughly 30-year cycle in the relationship between U.S. stock market returns and oil prices highlights periods when stocks are either expensive or cheap relative to oil. Image:…

S&P 500 Index and Technical Score

S&P 500 Index and Technical Score The U.S. stock market, with a reading of 81.85, has entered overbought territory—usually a sign of excessive buying pressure—and may be due for some price consolidation soon. Image: Real…

S&P 500 Index Returns Based on 4-Year Presidential Cycle

S&P 500 Index Returns Based on 4-Year Presidential Cycle Post-election years typically bring strong market gains. Since 1985, the S&P 500 has averaged gains of over 18%, with positive returns in 90% of cases. The…