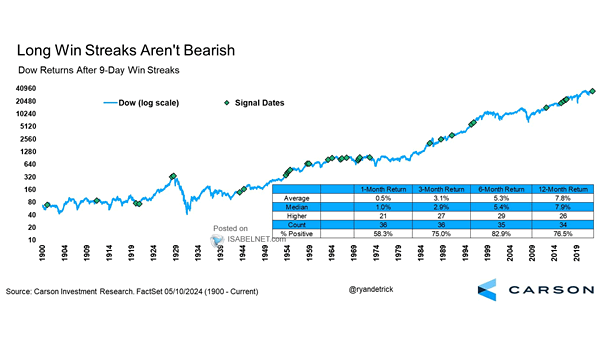
Nine Day Win Streaks for the S&P 500
Nine Day Win Streaks for the S&P 500 Nine-day winning streaks have been a reliable bullish signal for the S&P 500. In every instance since 1990, the index has been higher 12 months later, delivering…
Nine Day Win Streaks for the S&P 500 Nine-day winning streaks have been a reliable bullish signal for the S&P 500. In every instance since 1990, the index has been higher 12 months later, delivering…
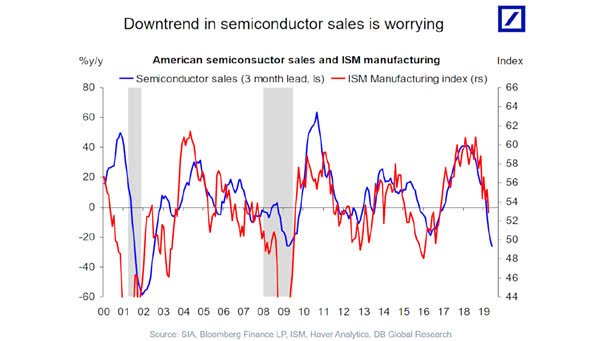
Daily Percentage Change in the Philadelphia Semiconductor Index (SOX) The Philadelphia Semiconductor Index (SOX) fell 10.26% last Friday, its sharpest decline since March 2020. The long-term story remains intact, but expectations had clearly overheated. Image:…
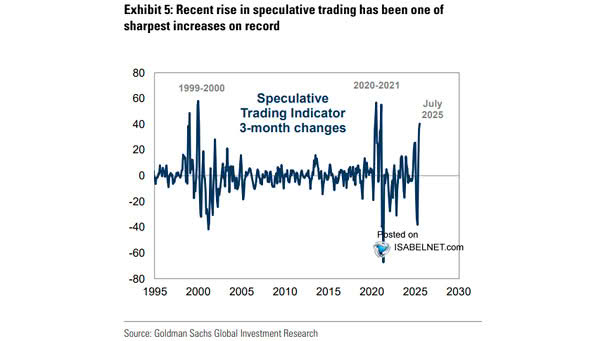
U.S. Equity Market Speculative Trading Indicator Animal spirits are building, but not yet overheating. Retail activity and Goldman Sachs’s Speculative Trading Indicator are firm, still short of past cycle peaks. Image: Goldman Sachs Global Investment…
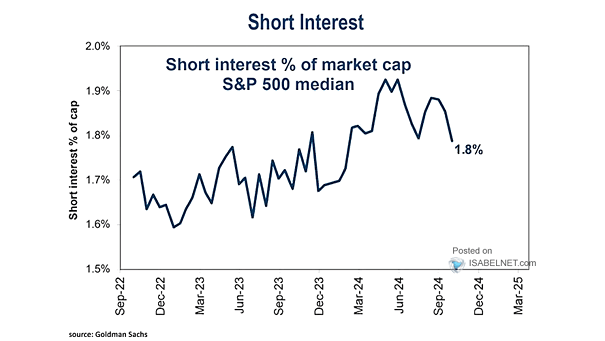
Short Interest as % of Market Capitalization S&P 500 Median Short interest in the median S&P 500 stock sits at 3.2%, a relatively elevated level, but the rise appears driven by hedging activity rather than…
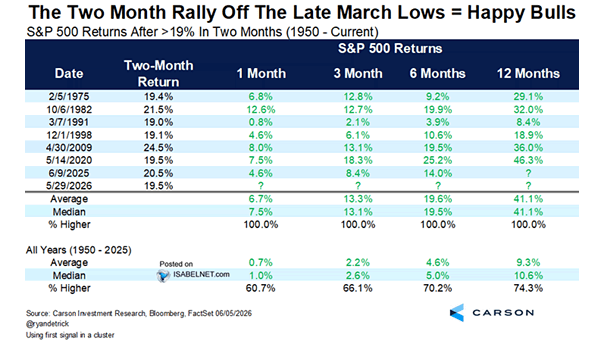
S&P 500 Returns After >19% in Two Months Since the late-March lows, the S&P 500 has rallied more than 19%. In similar rebounds, stocks have typically pushed higher over one-, three-, six-, and twelve-month horizons,…
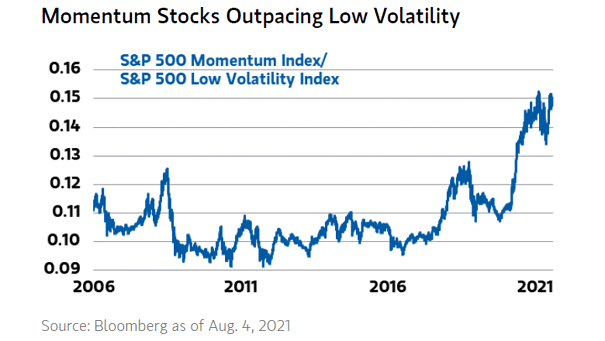
Relative Total Return Performance S&P 500 Momentum vs. Low Volatility Stocks The ratio of S&P 500 momentum to low volatility stocks is nearing Tech Bubble peaks, pointing to a tech-fueled late cycle. The trend can…

CPI Computers, Periph and Others vs. Import Price (Leading Indicator) AI may put upward pressure on near-term CPI, especially in computers, peripherals and related electronics, as surging demand lifts the cost of chips, memory and…
The Math of Drawdowns – Recovery Requied to Break Even After a Portfolio Decline Cut a portfolio in half and you need to double it to break even. That is not bad luck, it is…
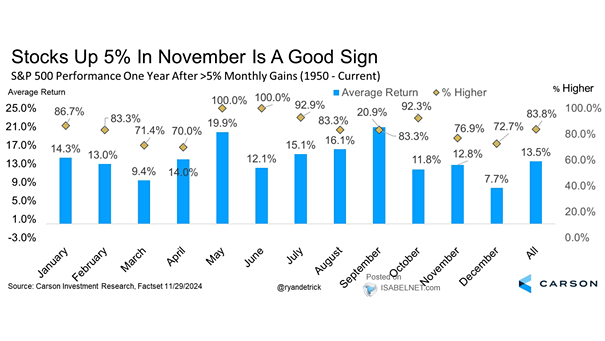
S&P 500 Performance One Year After 5% Monthly Gains The bulls have history on their side. Since 1950, a May rally of more than 5% in the S&P 500, like this year, has been followed…
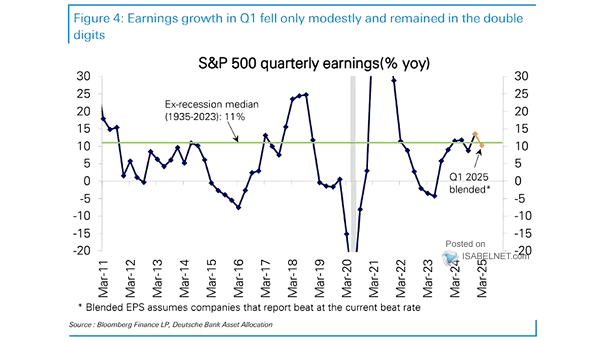
S&P 500 Quarterly Earnings Growth The rally in stocks was not just about price action; it was powered by the strongest S&P 500 earnings growth in at least four years. When earnings drive the move,…
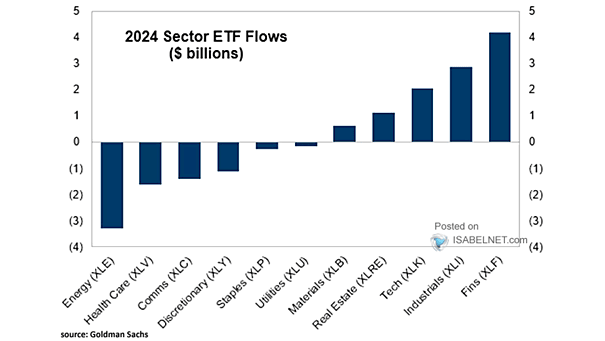
Sector ETF Flows Money is piling into tech. Since the S&P 500’s March 30 low, roughly $25 billion has flowed into tech sector ETFs, while non-tech sector ETFs have seen about $4 billion in combined…