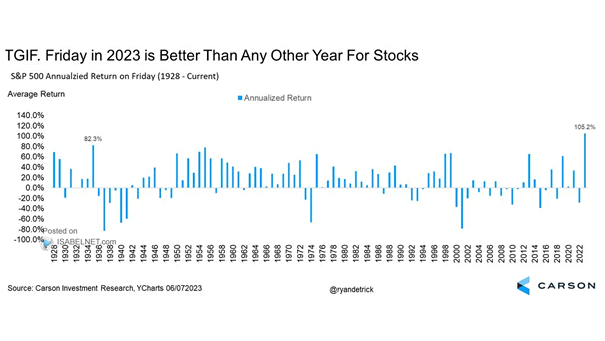
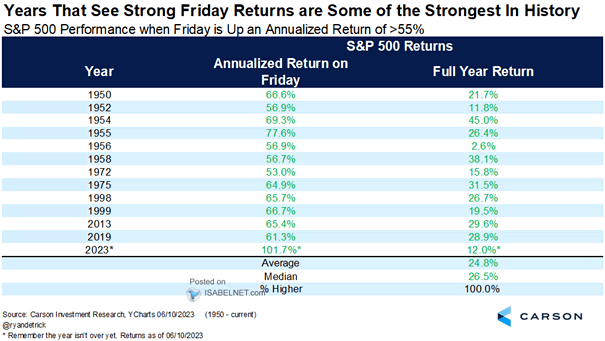
S&P 500 Tech Sector Relative Performance
S&P 500 Tech Sector Relative Performance Should investors be concerned about the relative performance of the tech sector? Image: Morgan Stanley Research
Path of Fed Funds During Previous Hiking Cycles The Fed has been particularly aggressive in raising rates to fight inflation compared to previous hiking cycles. Image: Goldman Sachs Global Investment Research
Valuation – S&P 500 Median Stock Forward P/E and S&P 500 Forward P/E The valuation of the S&P 500 remains at lofty levels. Image: Morgan Stanley Research
U.S. Dollar Index vs. 10Y-3M Real U.S. Treasury Yield Curve (Leading Indicator) The real U.S. yield curve suggests that the U.S. dollar may weaken over the next 12 months. Image: Morgan Stanley Wealth Management
S&P 500 Returns Around the End of Fed Hiking Cycles In recent history, U.S. stocks tend to rally if there is no recession following the end of Fed hiking cycles. Image: Goldman Sachs Global Investment…
Cumulative Quarterly Inflow to Cash Cash is making a strong comeback as interest rates rise. Image: BofA Global Investment Strategy
S&P 500 Returns After a 7% Gain in the First Quarter Since 1954, when the S&P 500 gained more than 7% in the first quarter, bears cried and bulls smiled throughout the year. Image: Carson…
Big Tech Stocks % of S&P 500 Market Capitalization Will the weight of big tech stocks in the S&P 500 continue to decline in 2023? Image: BofA Global Investment Strategy
WTI Oil Price vs. CPI Inflation (Leading Indicator) Oil prices tend to lead U.S. CPI inflation by 6 months. Image: Alpine Macro
S&P 500 ERP and S&P 500 Fwd vs. Trailing EPS The S&P 500 looks unattractive until the equity risk premium increases. Image: Morgan Stanley Research
Dividend Yield Global ex-U.S. equities continue to offer higher dividend yields than U.S. equities. Image: Topdown Charts