Median S&P 500 Returns by Day of Week
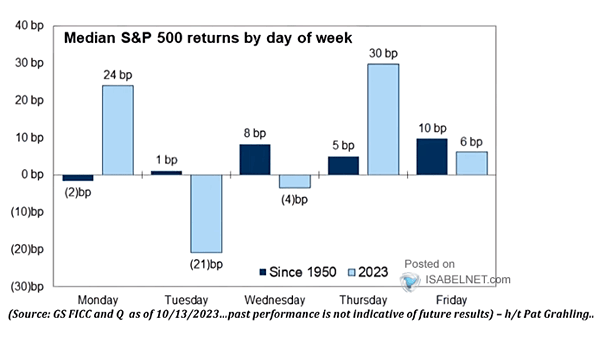
Median S&P 500 Returns by Day of Week Monday and Thursday are the most favorable days for U.S. stocks so far this year, with the highest levels of performance and potential profitability among all the…
Median S&P 500 Returns by Day of Week Monday and Thursday are the most favorable days for U.S. stocks so far this year, with the highest levels of performance and potential profitability among all the…
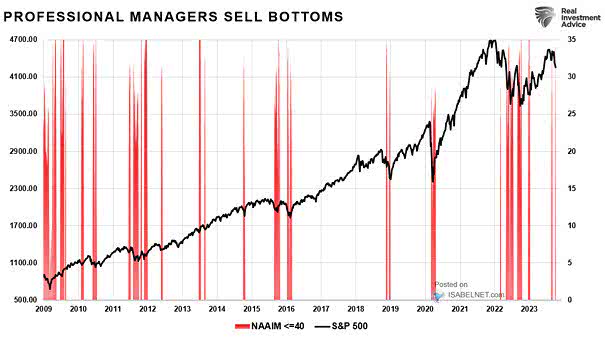
Investor Sentiment – S&P 500 and NAAIM Index Below 40 The NAAIM index dropping below 40 is often interpreted as active investment managers selling equities at market bottoms, signaling a potential short-term market bottom. Image:…
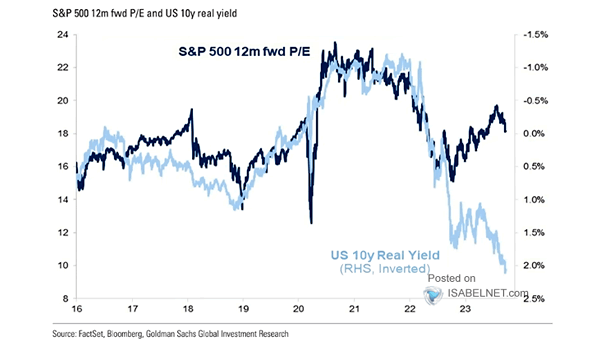
Valuation – S&P 500 Forward P/E and 10-Year U.S. Real Yield Is the current disconnect between the valuation of U.S. stocks and the impact of real interest rates on the economy expected to be temporary?…
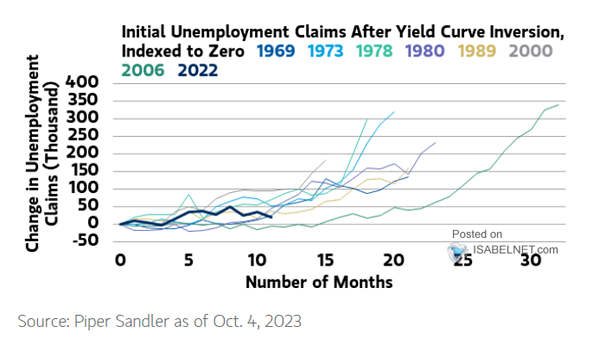
U.S. Initial Unemployment Claims After Yield Curve Inversion Is there a difference this time in the association between an inverted yield curve, usually indicating economic decline, and the potential for job losses? Image: Morgan Stanley…
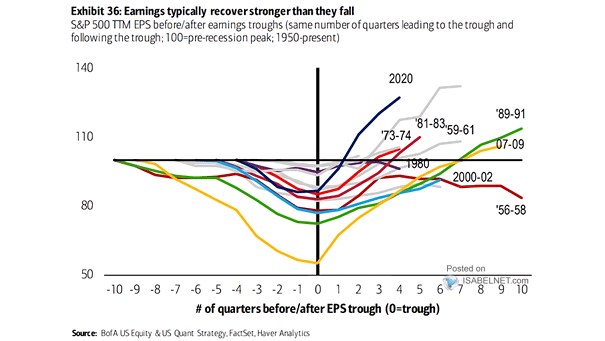
S&P 500 TTM EPS Before/After Earnings Troughs After a period of decline, S&P 500 earnings tend to rebound and grow at a faster rate than the decline they experienced. This pattern may not apply to…
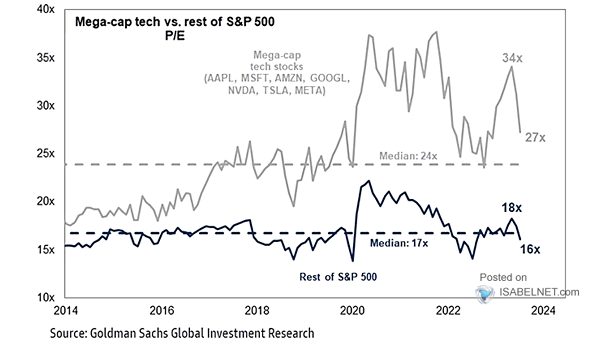
Valuation – Mega-Cap Tech vs. Rest of S&P 500 P/E Compared to the mega-cap tech stocks, the remaining stocks in the S&P 500 appear to be priced at a more reasonable level. Image: Goldman Sachs…
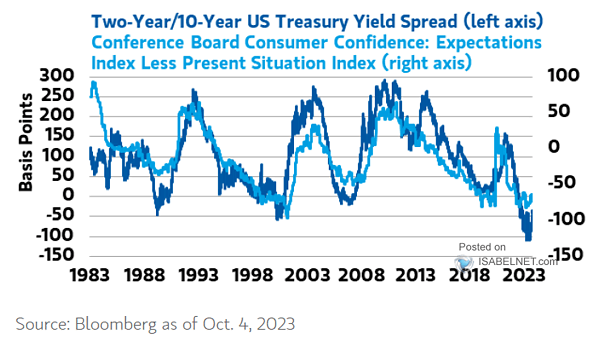
Conference Board Consumer Confidence and U.S. Treasury Yield Curve Historically, the U.S. Treasury yield curve has tended to follow consumer confidence, underscoring the importance of monitoring consumer confidence as a potential indicator of future yield…
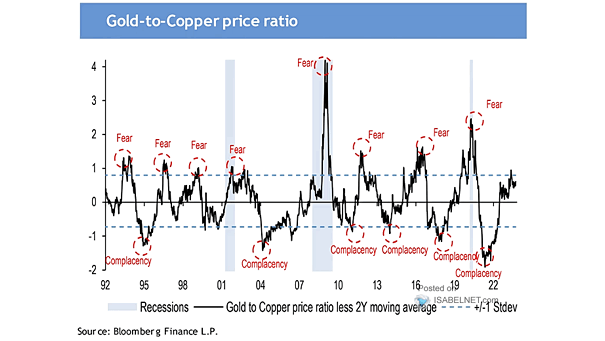
Gold-to-Copper Price Ratio The gold-to-copper price ratio is currently far from a level of complacency. Image: J.P. Morgan
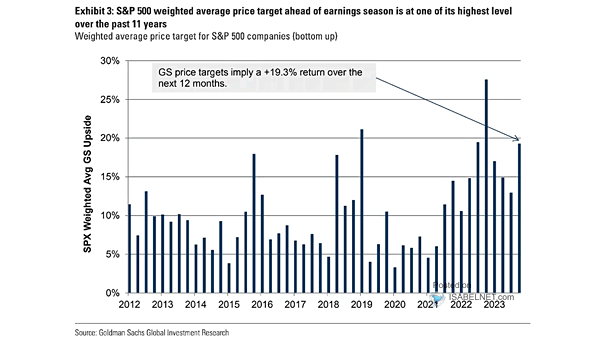
Weighted Average Price Target for S&P 500 Companies Goldman Sachs price targets imply a +19.3% return over the next 12 months, which suggests a bullish sentiment and very optimistic outlook. Image: Goldman Sachs Global Investment…
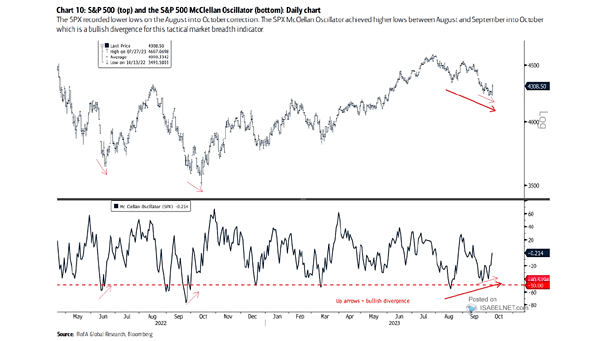
S&P 500 McClellan Oscillator The bullish divergence in the S&P 500 McClellan oscillator implies underlying buying pressure, signaling positivity for U.S. stocks and increasing the likelihood of a market reversal or bounce back. Image: BofA…
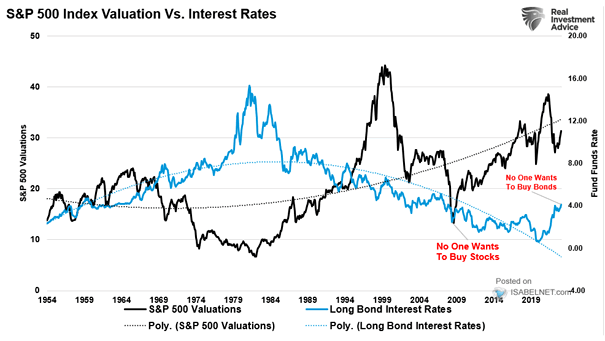
S&P 500 Index Valuation vs. Interest Rates The S&P 500 trading at relatively high valuations, should investors consider overweighting U.S. Treasury bonds while simultaneously underweighting U.S. equities in their investment portfolios? Image: Real Investment Advice