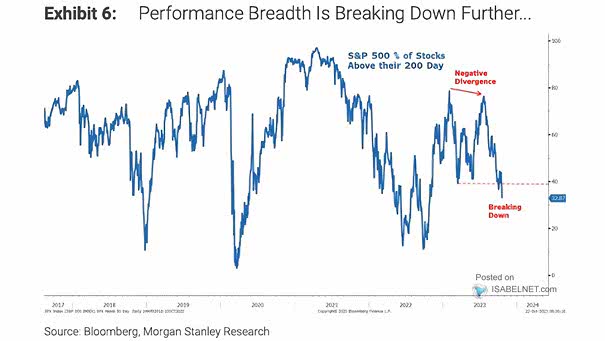
Time Series of S&P 500 Price, Forward EPS and Price to Forward EPS
Time Series of S&P 500 Price, Forward EPS and Price to Forward EPS The S&P 500 has returned to its January 2022 level. Image: BofA US Equity & Quant Strategy
Recession – Percentage of U.S. Treasury Yield Curves Inverted The risk of a U.S. recession cannot be ruled out. Image: Charles Schwab
Healthcare Flows Inflows to healthcare are strong. Should investors consider sticking with healthcare funds? Image: BofA Global Investment Strategy
PMI vs. Equity Risk Premium The divergence between the ISM PMI and the equity risk premium is significant. Image: Morgan Stanley Research
Professional Forecasters Probability of Recession U.S. recession fears among professional forecasters remain elevated. Image: Goldman Sachs Global Investment Research
Inflation – U.S. 5-Year, 5-Year Forward Breakeven Rate U.S. bond market expectations for inflation are rising again, which is not good news. Image: The Daily Shot
S&P 500 GICs Level 1 Sector Weekly Relative Rotation Graph Will technology and discretionary stocks continue to lead? Image= BofA Global Research
Fed Funds Rate Less U.S. Core PCE Is the Federal Reserve’s monetary policy really restrictive in order to return inflation to 2%? Image: Morgan Stanley Wealth Management
U.S. Public Debt Outstanding The U.S. public debt is projected to continue growing by $5.2 billion every day over the next 10 years. Image: BofA Global Investment Strategy
Energy vs. Consumer Discretionary Stocks Should investors remain long energy stocks? Image: BofA Global Investment Strategy
Nasdaq 100 vs. 10-Year U.S. TIPS Yield (Inverted) The Nasdaq 100 has shown strong performance despite the rise in real yields, which may indicate the possibility of the market overheating. Image: The Daily Shot