Global High Yield Bond Prices
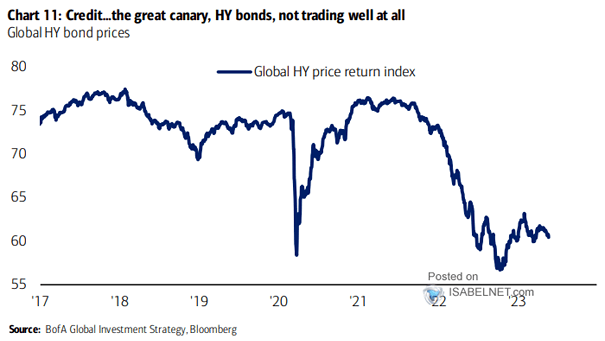
Global High Yield Bond Prices High-yield bonds are often called the “canary in the coal mine”, as they are seen as a leading indicator of the health of the economy. Image: BofA Global Investment Strategy
Global High Yield Bond Prices High-yield bonds are often called the “canary in the coal mine”, as they are seen as a leading indicator of the health of the economy. Image: BofA Global Investment Strategy
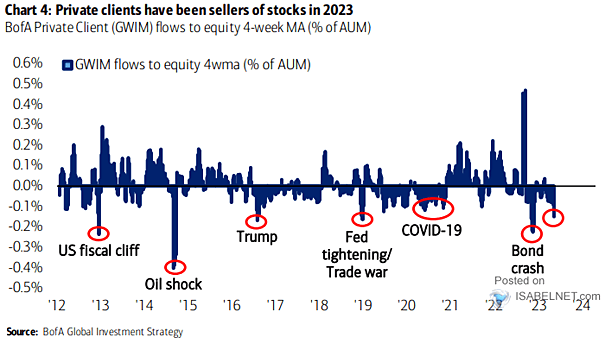
GWIM Equity Flows BofA’s private clients have been sellers of stocks this year. Image: BofA
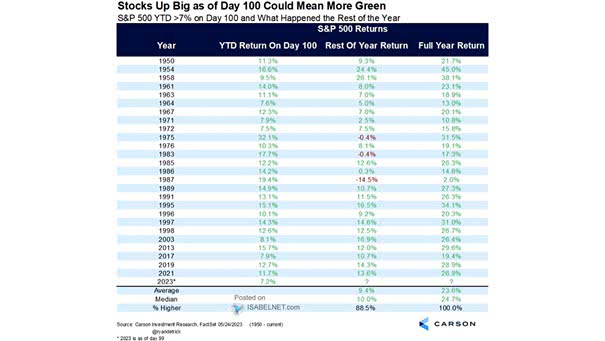
S&P 500 YTD >7% on Day 100 and What Happened the Rest of the Year Historically, when the S&P 500 Index has recorded a gain over 7% on day 100, it has tended to signal…
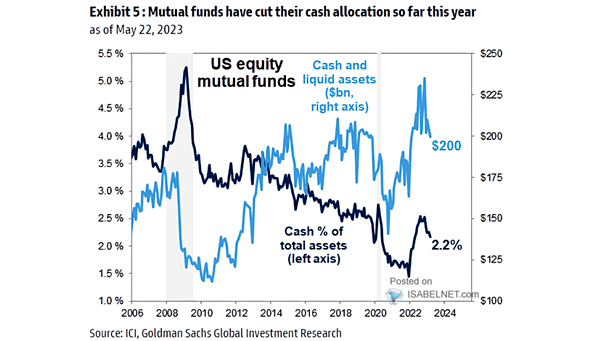
U.S. Equity Mutual Funds – Cash and Liquid Assets Cash holdings of mutual funds are going down. Image: Goldman Sachs Global Investment Research
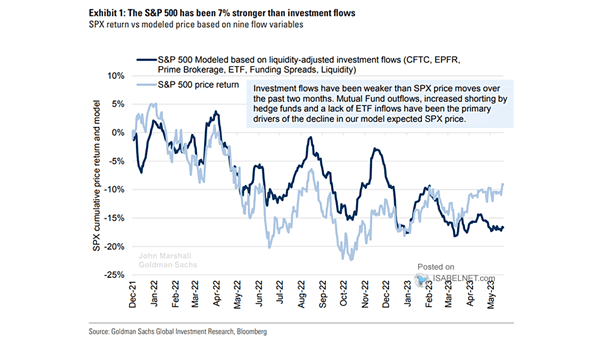
S&P 500 Return vs. Modeled Price Based on Nine Flow Variables Goldman Sachs expects the S&P 500’s growth potential to be limited, as S&P 500 daily returns are typically linked with inflows. Image: Goldman Sachs…
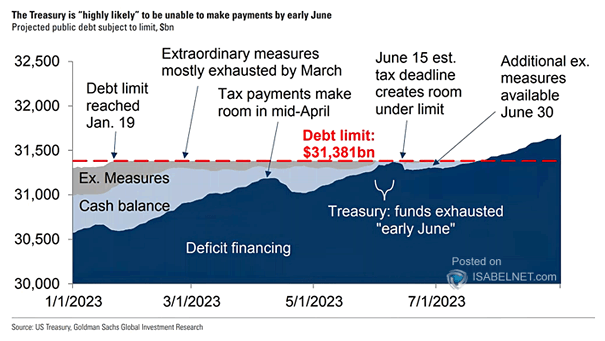
U.S. Debt Ceiling If Congress fails to raise the debt ceiling, it is probable that the U.S. Treasury will not be able to pay its bills completely and promptly in early June 2023. Image: Goldman…
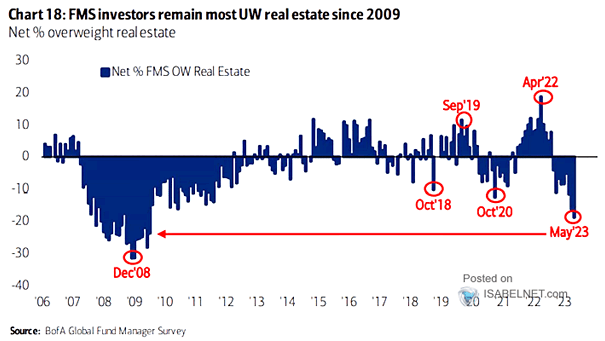
FMS Investors – Net % Overweight Real Estate FMS investors continue to have a pessimistic outlook on the real estate market. Image: BofA Global Fund Manager Survey
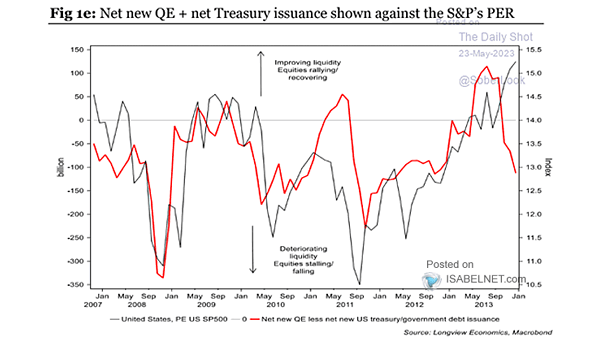
Valuation – S&P 500 PE vs. Liquidity Deteriorating liquidity may be a significant headwind for the S&P 500. Image: Longview Economics
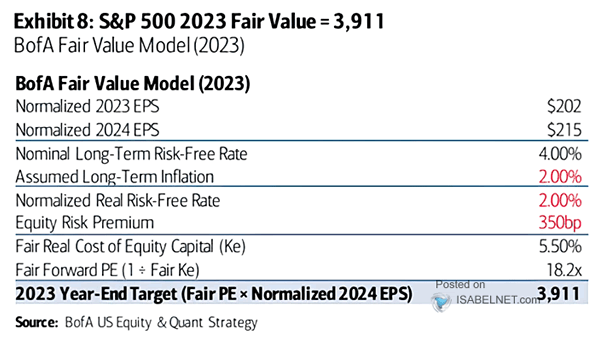
S&P 500 Fair Value According to BofA, the fair value of the S&P 500 is 3,911 by year-end 2023 (bear case, based on the most bearish model). Image: BofA Global Research
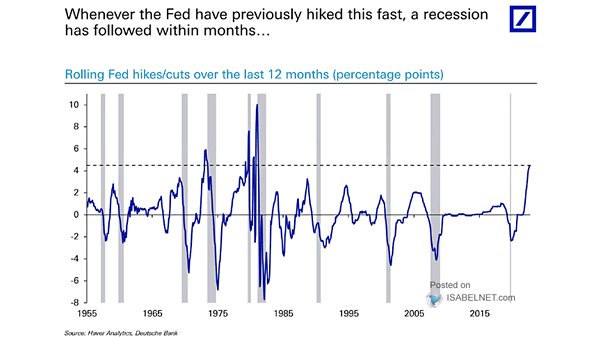
Rolling Fed Hikes/Cuts Over the Last 12 Months and Recessions When the Fed increases interest rates too quickly or aggressively, it can lead to a recession. Image: Deutsche Bank
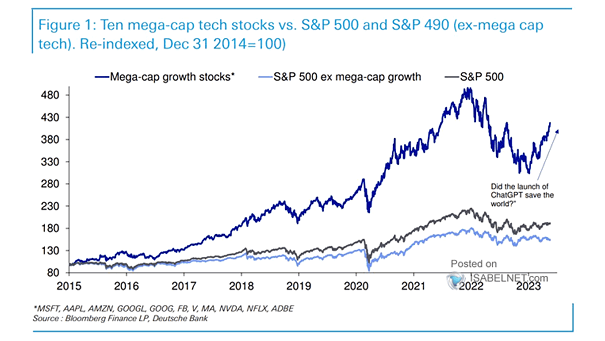
Mega-Cap Growth Stocks vs. S&P 500 Will artificial intelligence propel mega-cap growth stocks to all-time highs? Image: Deutsche Bank