Recession – U.S. Continuing Jobless Claims
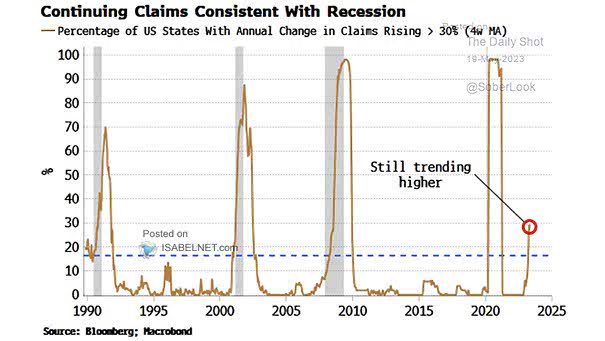
Recession – U.S. Continuing Jobless Claims U.S. continuing jobless claims can serve as a warning sign of an upcoming recession. Image: Bloomberg
Recession – U.S. Continuing Jobless Claims U.S. continuing jobless claims can serve as a warning sign of an upcoming recession. Image: Bloomberg
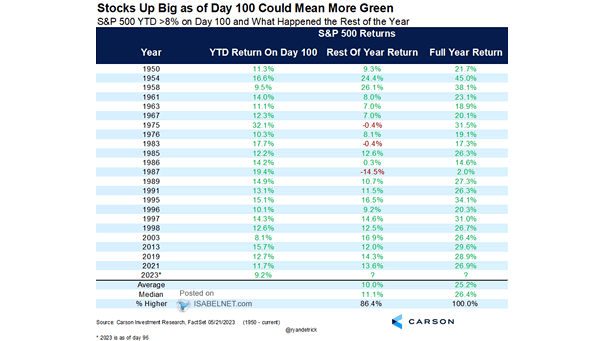
S&P 500 YTD >8% on Day 100 and What Happened the Rest of the Year Historically, when the S&P 500 is up more than 8% on day 100, the rest of the year tends to…
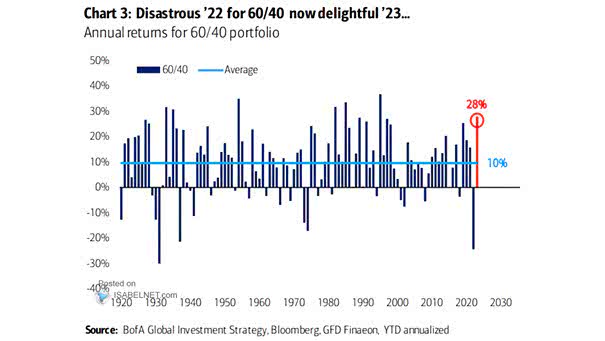
Returns for 60/40 Portfolio So far, the traditional 60% stocks and 40% bonds portfolio is performing well year-to-date. Image: BofA Global Investment Strategy
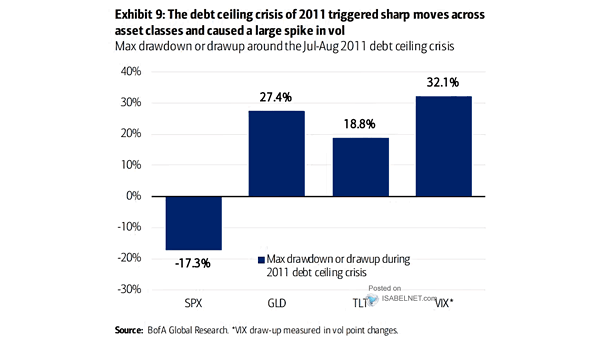
U.S. Debt Ceiling Historically, Gold tends to be the best hedge against U.S. debt ceiling concerns. Image: BofA Global Research
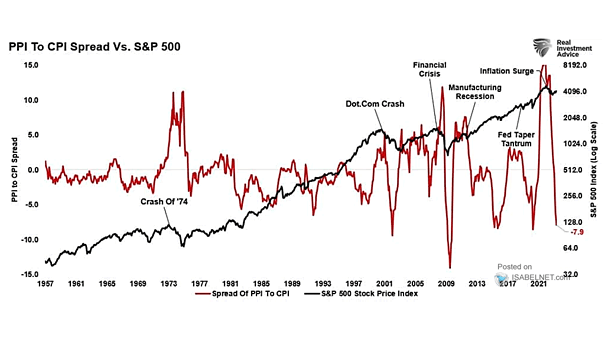
Inflation – PPI to CPI Spread vs. S&P 500 A collapse of the spread between PPI (Producer Price Index) and CPI (Consumer Price Index) may be interpreted as a sign of decreased inflationary pressures, which…
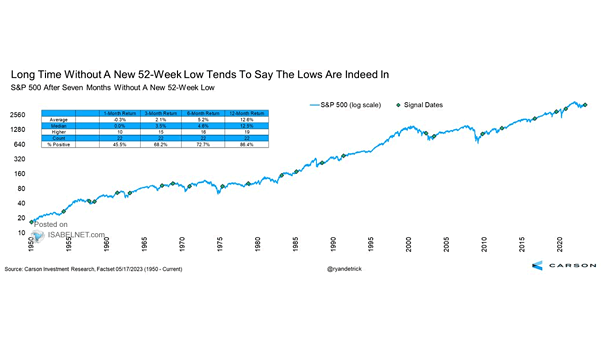
S&P 500 After Seven Months Without A New 52-Week Low When the S&P 500 has gone 7 months without a new 52-week low, it tends to be bullish over the next 12 months. Image: Carson…
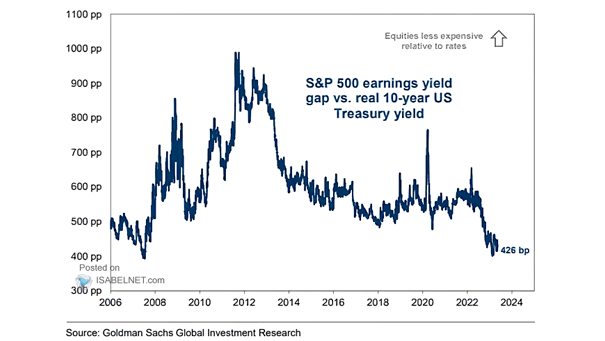
S&P 500 Earnings Yield Gap vs. Real 10-Year U.S. Real Treasury Yield U.S. equities look expensive relative to rates. Image: Goldman Sachs Global Investment Research
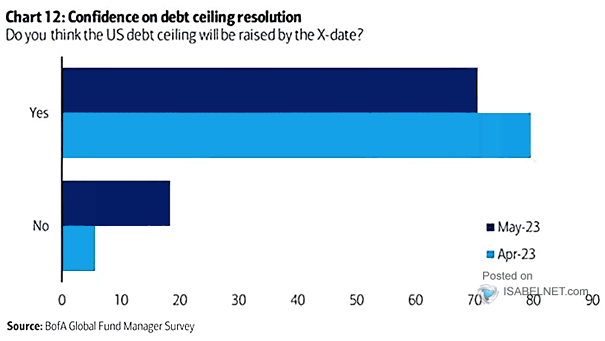
U.S. Debt Ceiling The U.S. debt ceiling is a crucial issue. FMS investors are confident that the debt ceiling will be resolved. Image: BofA Global Investment Strategy
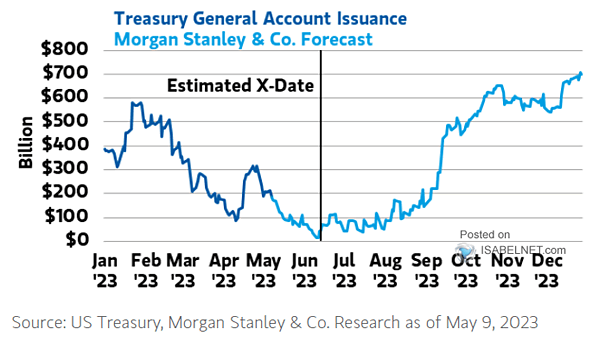
Treasury General Account Issuance U.S. Treasury issuance is expected to increase after the debt ceiling agreement, which could drain liquidity from the system. Image: Morgan Stanley Wealth Management
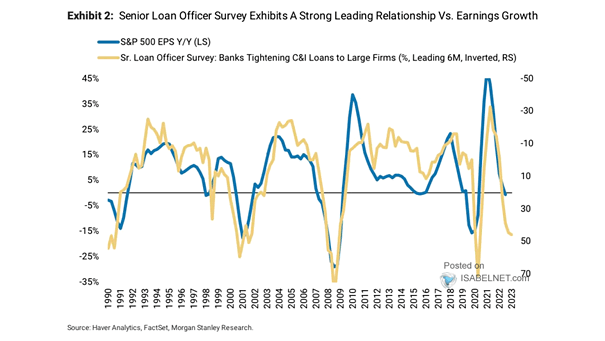
Senior Loan Officer Survey and S&P 500 EPS A continued slowdown in earnings growth is expected through the end of the year. Image: Morgan Stanley Research
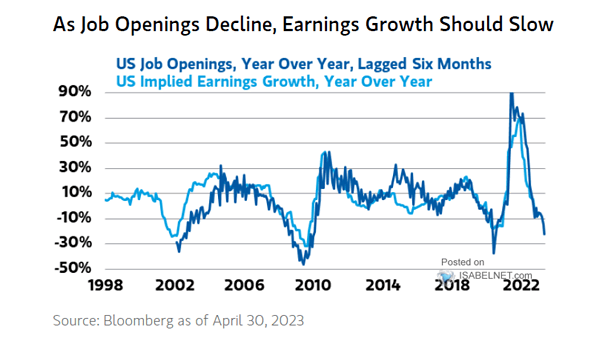
U.S. Job Openings vs. U.S. Implied Earnings Growth The decline in U.S. job openings may not bode well for earnings growth. Image: Morgan Stanley Wealth Management