Where Will 10-Year U.S. Treasury Yield End the Year?
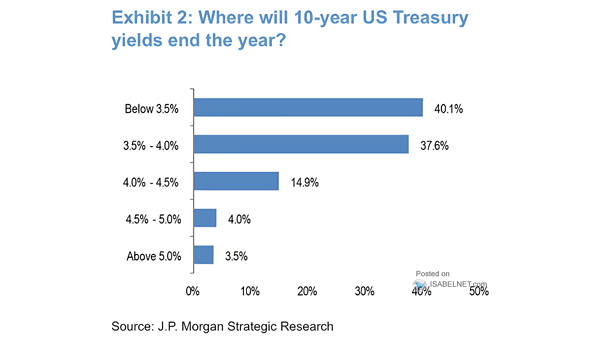
Where Will 10-Year U.S. Treasury Yield End the Year? Will the 10-Year U.S. Treasury yield end the year below 3.5%? Image: J.P. Morgan
Where Will 10-Year U.S. Treasury Yield End the Year? Will the 10-Year U.S. Treasury yield end the year below 3.5%? Image: J.P. Morgan
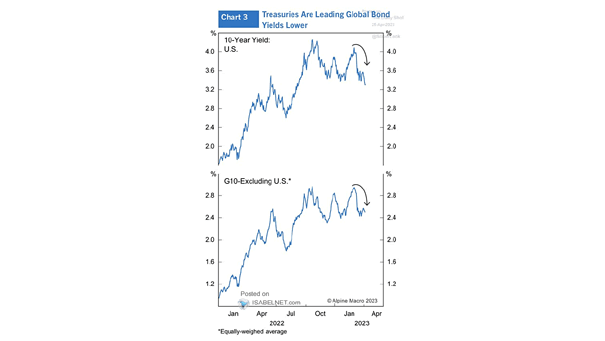
10-Year Yield: U.S. vs. G10 excluding U.S. Should investors expect global bond yields to fall? Image: Alpine Macro
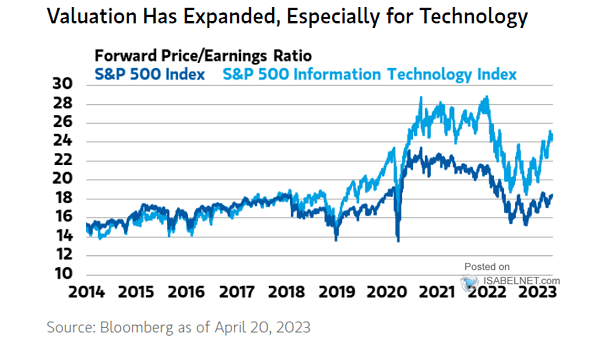
Valuation – S&P 500 Forward 12-Month Price/Earnings Ratio Are markets overly optimistic, especially for technology? Image: Morgan Stanley Wealth Management
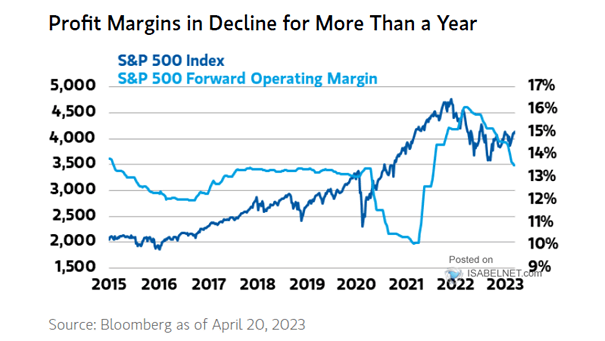
S&P 500 Operating Margins Will the profitability of S&P 500 companies improve in the coming quarters? Image: Morgan Stanley Wealth Management
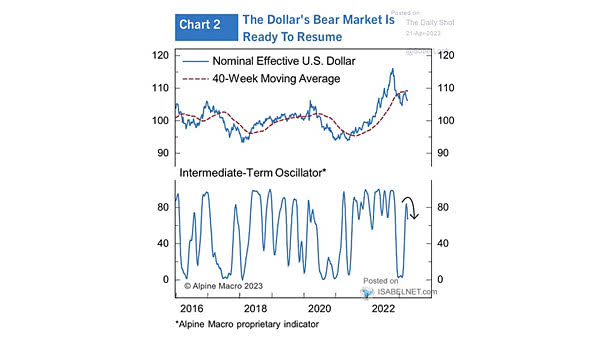
Nominal Effective U.S. Dollar Will the U.S. dollar weaken again? Image: Alpine Macro
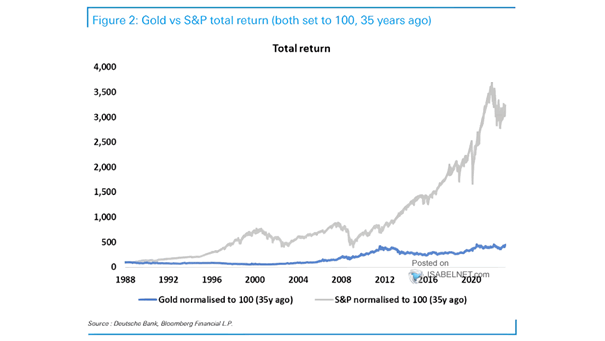
Gold vs. S&P 500 Total Return Historically, both gold and U.S. equities have delivered positive returns to long-term investors. Image: Deutsche Bank
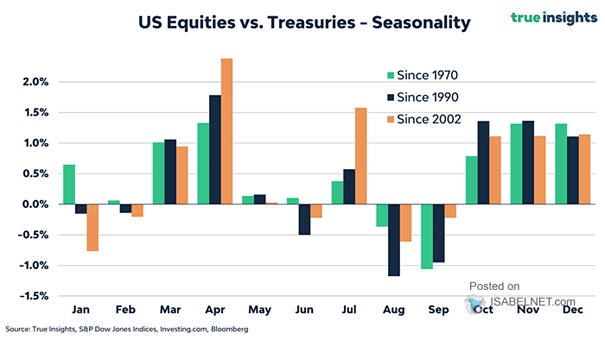
Seasonality – U.S. Equities vs. Treasuries Investors can profit from the seasonality of markets, as it is one factor that can impact asset prices. Image: True Insights
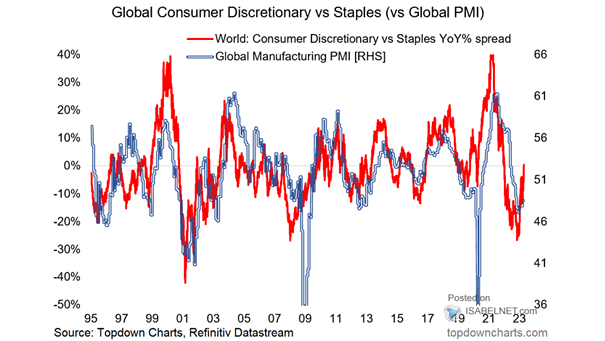
Global Manufacturing PMI and Global Consumer Discretionary vs. Staples The global consumer discretionary vs. staples relative performance suggests that the global manufacturing PMI could be trending towards expansion, which is good news. Image: Topdown Charts
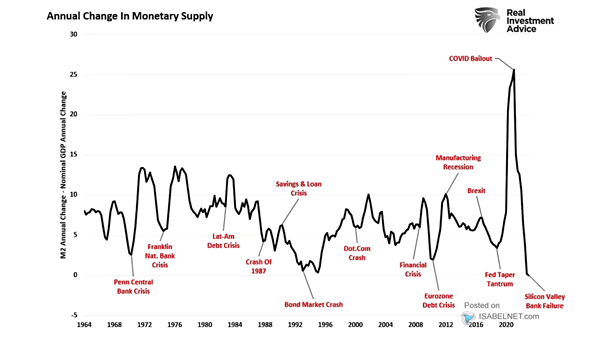
Annual Change in Monetary Supply Draining liquidity has historically been a major concern in financial markets, as it can lead to significant disruptions and have broader impacts on the economy. Image: Real Investment Advice
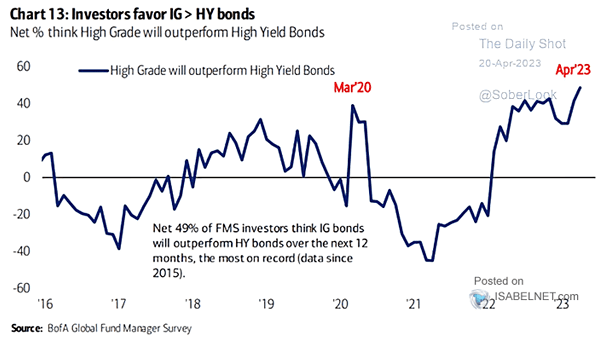
FMS Investors – Net % Think High Grade Will Outpferform High Yield Bonds Will high yield bonds outperform IG bonds over the next 12 months? Image: BofA Global Fund Manager Survey
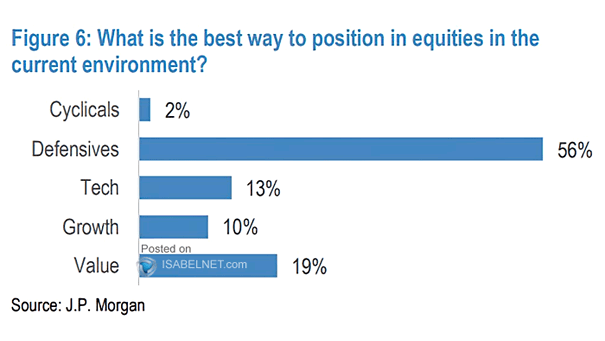
What Is the Best Way to Position in Equities in the Current Environment? Should investors favor defensive equities in the current environment of slow economic growth with inflation? Image: J.P. Morgan