Valuation – S&P 500 PE Ratio and Bond Yields
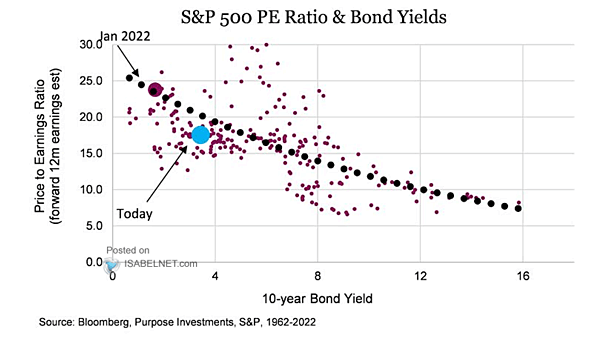
Valuation – S&P 500 PE Ratio and Bond Yields Bond yields have an impact on the equity market multiple. Image: Richardson Wealth
Valuation – S&P 500 PE Ratio and Bond Yields Bond yields have an impact on the equity market multiple. Image: Richardson Wealth
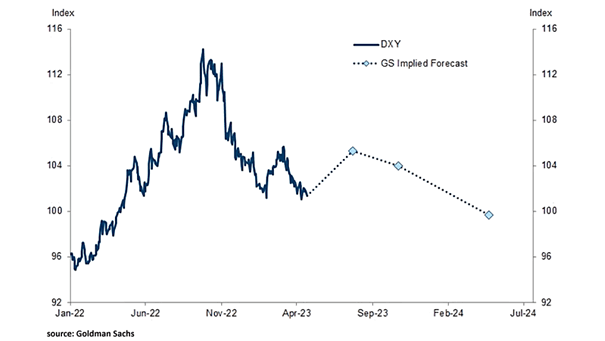
U.S. Dollar Index (DXY) Goldman Sachs is less bearish on the U.S. dollar in 2023, given the weakness of the global economy. Image: Goldman Sachs Global Investment Research
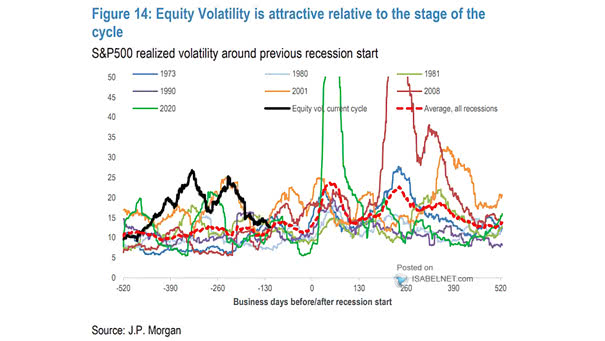
S&P 500 Realized Volatility Around Previous Recession Start U.S. equity volatility looks attractive. Image: J.P. Morgan
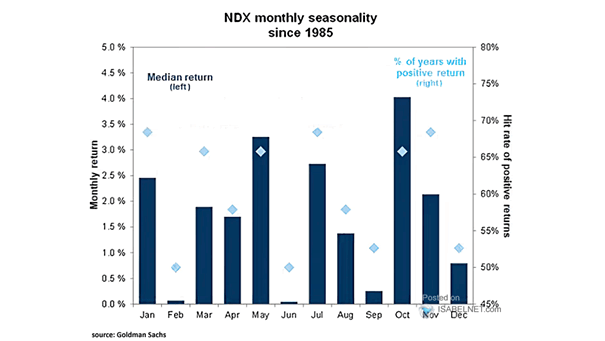
Seasonality – Nasdaq Monthly Returns Seasonality is very useful for assessing probabilities, not certainties. This is one factor that can impact the Nasdaq price. Image: Goldman Sachs Global Investment Research
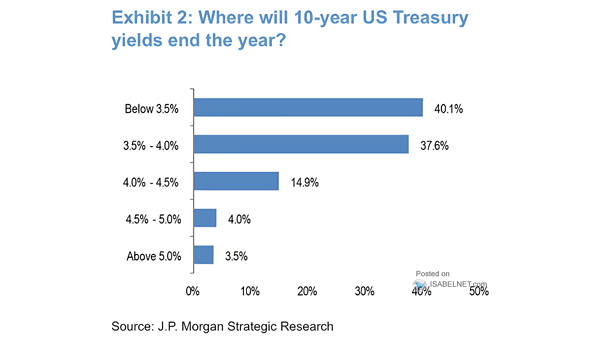
Where Will 10-Year U.S. Treasury Yield End the Year? Will the 10-Year U.S. Treasury yield end the year below 3.5%? Image: J.P. Morgan
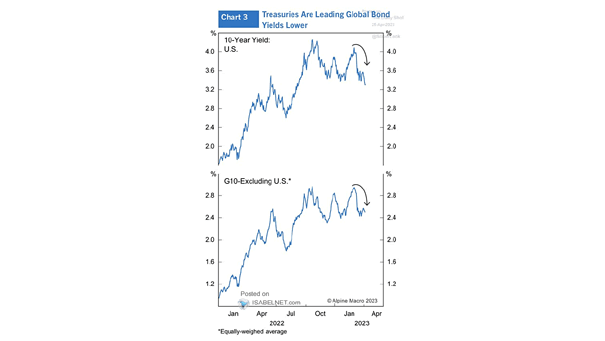
10-Year Yield: U.S. vs. G10 excluding U.S. Should investors expect global bond yields to fall? Image: Alpine Macro
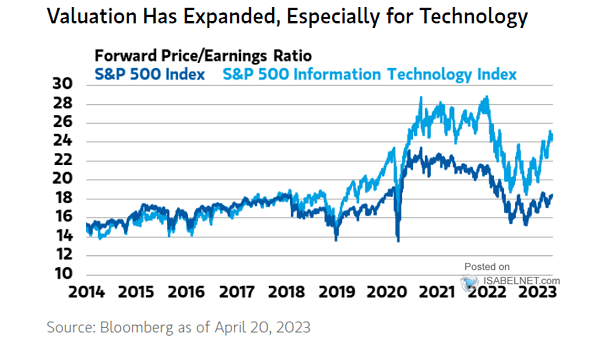
Valuation – S&P 500 Forward 12-Month Price/Earnings Ratio Are markets overly optimistic, especially for technology? Image: Morgan Stanley Wealth Management
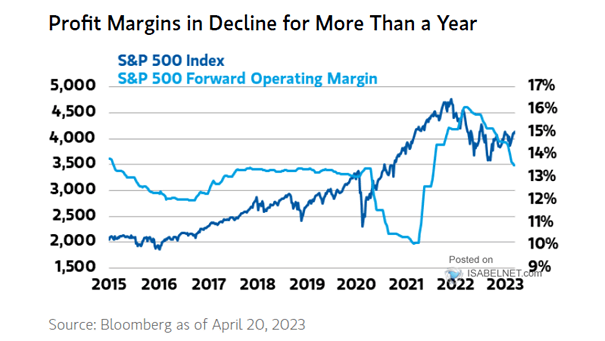
S&P 500 Operating Margins Will the profitability of S&P 500 companies improve in the coming quarters? Image: Morgan Stanley Wealth Management
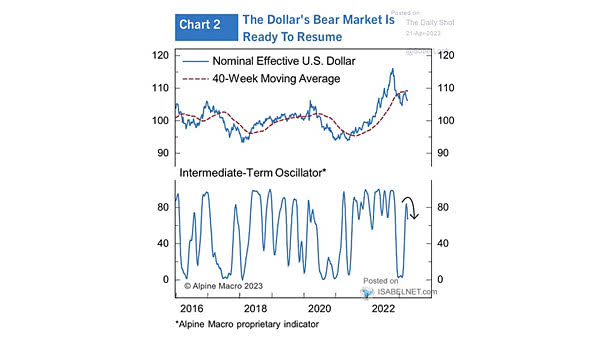
Nominal Effective U.S. Dollar Will the U.S. dollar weaken again? Image: Alpine Macro
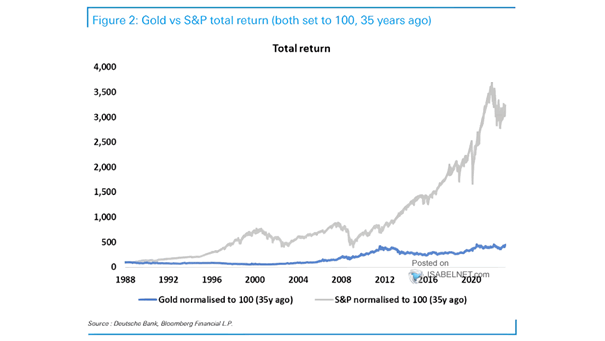
Gold vs. S&P 500 Total Return Historically, both gold and U.S. equities have delivered positive returns to long-term investors. Image: Deutsche Bank
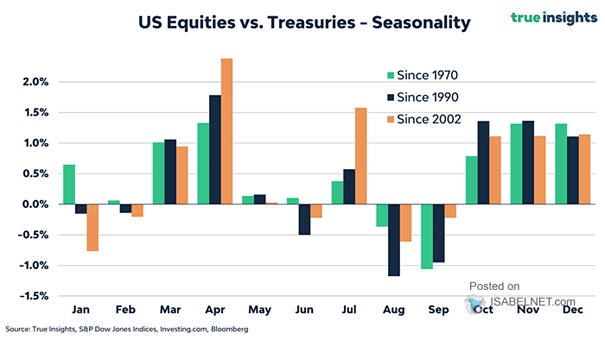
Seasonality – U.S. Equities vs. Treasuries Investors can profit from the seasonality of markets, as it is one factor that can impact asset prices. Image: True Insights