Loan Demand
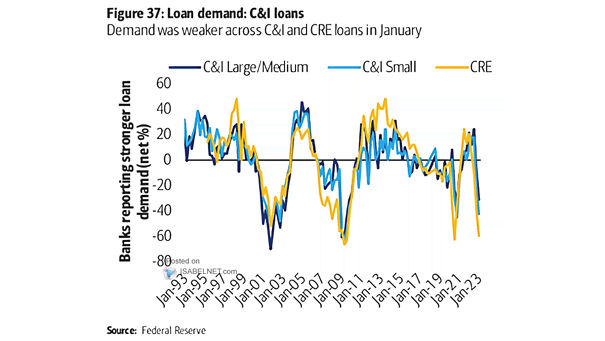
Loan Demand Demand for commercial & industrial (C&I) and commercial real estate (CRE) loans remains weak, which does not bode well for a soft landing. Image: BofA Global Research
Loan Demand Demand for commercial & industrial (C&I) and commercial real estate (CRE) loans remains weak, which does not bode well for a soft landing. Image: BofA Global Research
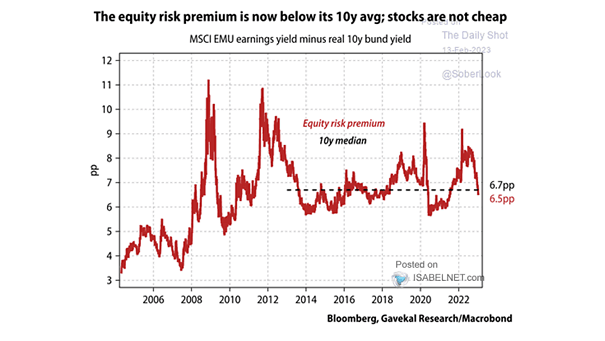
Stocks – MSCI EMU Earnings Yield Minus Real 10-Year Bund Yield (Equity Risk Premium) The equity risk premium below its 10-year average does not bode well for eurozone stocks. Image: Gavekal, Macrobond
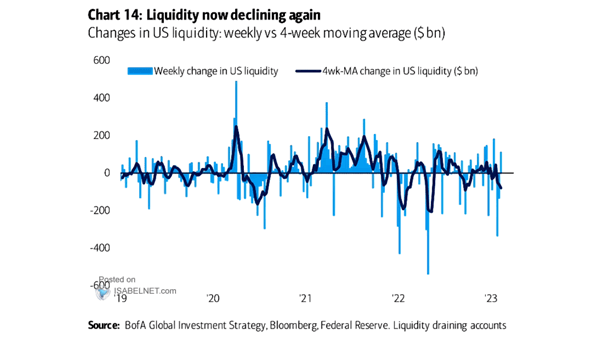
Changes in U.S. Liquidity U.S. liquidity is declining, which is a headwind for U.S. stocks. Image: BofA Global Investment Strategy
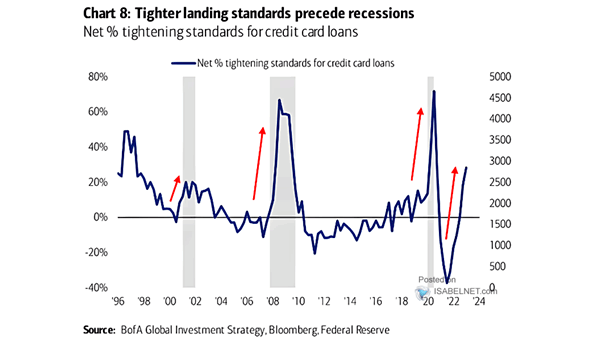
U.S. Recession – Net % Tightening Standards for Credit Card Loans U.S. banks are concerned about the risk of a recession, as they are tightening their lending standards. Image: BofA Global Investment Strategy
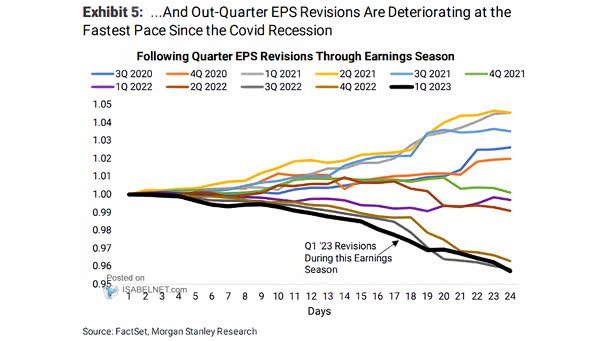
Following Quarter EPS Revisions Through Earnings Season EPS revisions are rapidly deteriorating. An earnings recession is currently not priced in by the market. Image: Morgan Stanley Research
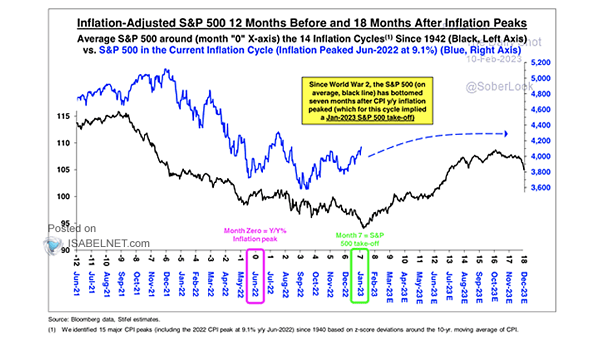
Inflation-Adjusted S&P 500 12 Months Before and 18 Months After Inflation Peaks Since WWII, the S&P 500 has bottomed seven months after the peak in CPI inflation. Image: Stifel
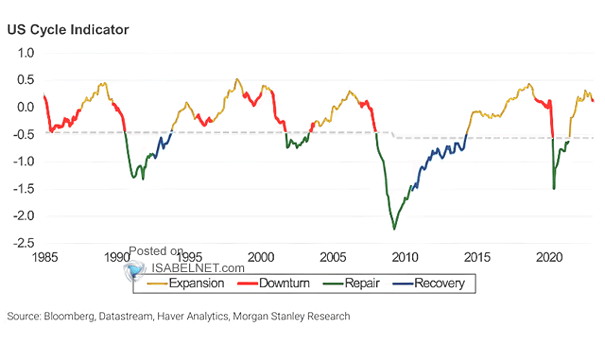
U.S. Business Cycle – Cross-Asset Cycle Indicator The Morgan Stanley’s U.S. cycle indicator has moved into the downturn phase. Should investors favor fixed income over equities? Image: Morgan Stanley Research
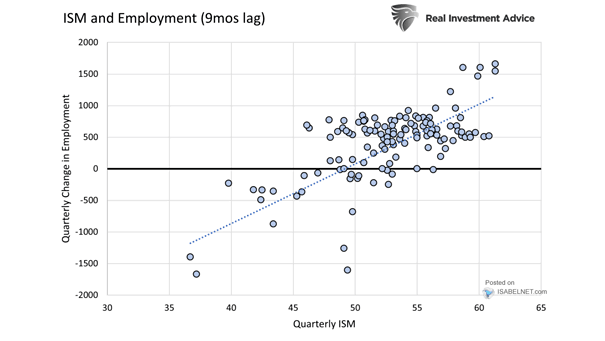
U.S. ISM Manufacturing Index and U.S. Employment It is important to keep a close eye on the U.S. ISM Manufacturing Index for any changes in U.S. employment.
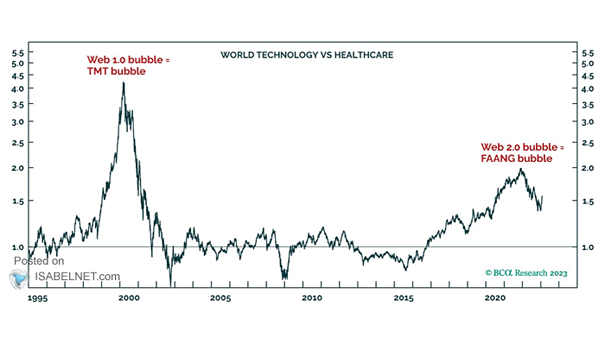
Performance – World Technology vs. Healthcare Is it the end of the FAANG bubble? Image: BCA Research
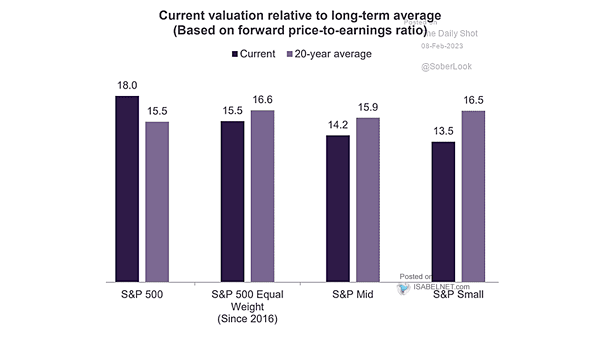
Current Valuation Relative to Long-term Average The S&P 500 Index remains historically expensive. Image: Truist
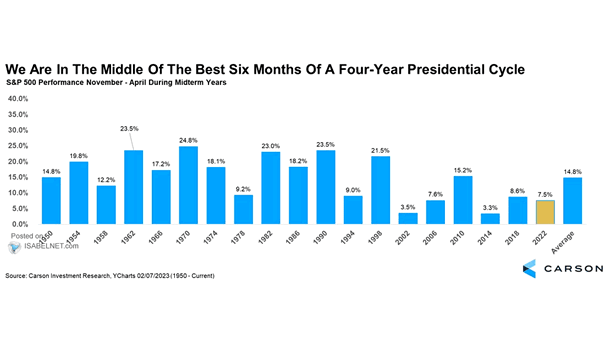
S&P 500 Performance November – April During Midterm Years Historically, the six months from November through April have seen the best performance for U.S. stocks following midterm elections. Image: Carson Investment Research