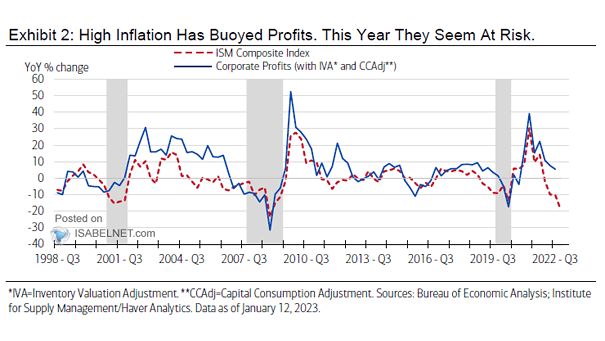
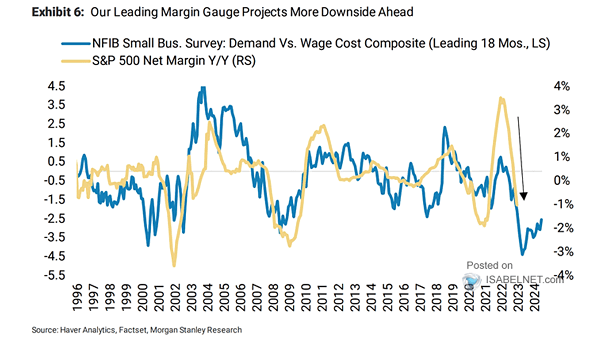
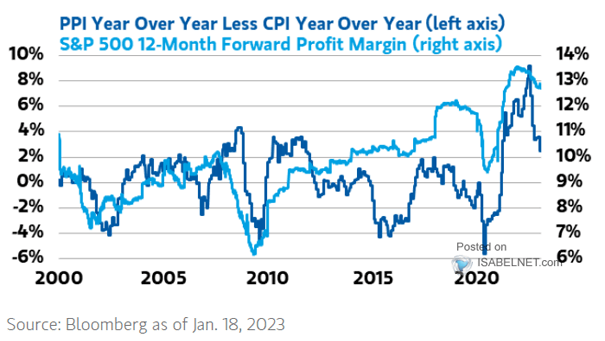
% of Days Higher per Year for the S&P 500

% of Days Higher per Year for the S&P 500 This is definitely not a good year for U.S. stocks, as only 43.1% of the days have closed in the green for the S&P 500…

Asia Dollar Index

Asia Dollar Index Could Asian currencies continue to weaken, as global recession fears mount? Image: BofA Global Investment Strategy

S&P 500 Index vs. M2 Money Supply

S&P 500 Index vs. M2 Money Supply Global M2 money supply growth has a significant impact on U.S. stocks. Image: Morgan Stanley Wealth Management

U.S. 10Y-5Y Yield Curve and Recessions

U.S. 10Y-5Y Yield Curve and Recessions Can investors expect a steepening yield curve as a recession hedge? Image: BofA Global Investment Strategy

U.S. Bear Markets Rallies

U.S. Bear Markets Rallies Bear markets rallies tend to be sharp and short-lived. Image: MarketDesk Research

Fed Funds Annual Rate of Change

Fed Funds Annual Rate of Change Is the Fed making a policy mistake by being too aggressive? Image: Real Investment Advice

S&P 500 Following Yield Curve Inversions

S&P 500 Following Yield Curve Inversions Historically, the inversion of the 10Y-3M yield curve is not an immediate sell signal for U.S. stocks. Image: MarketDesk Research