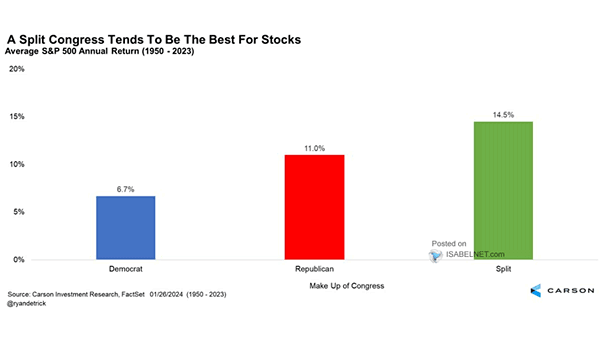
S&P 500 Use of Cash

S&P 500 Use of Cash The S&P 500’s capex growth in 2025 reflects a broad-based rise, driven by AI-related tech investments and strategic shifts in production and automation, underpinned by expectations of strong returns. Image:…

Top 10 Mega Caps and Bottom 440 Stocks

Top 10 Mega Caps and Bottom 440 Stocks In the S&P 500, the top 10 stocks carry so much weight that they impact the index nearly as much as the bottom 440 together, showing how…

S&P 500 Buyback Yield

S&P 500 Buyback Yield While S&P 500 share buybacks remain significant, their impact on reducing share counts and boosting returns to shareholders is diminishing compared to past years. Image: Goldman Sachs Global Investment Research

Market-Implied U.S. Recession Probability

Market-Implied U.S. Recession Probability The market-implied probability of a U.S. recession within one year is modestly elevated but not extremely high. Image: Goldman Sachs Global Investment Research

S&P 500 – U.S. Broad Market Net Forward Profit Margin

S&P 500 – U.S. Broad Market Net Forward Profit Margin Elevated profit margins in the U.S. broad market, which continue to show forward-looking expansion, point to underlying economic resilience and do not align with the…

Top 10 Mega Cap Stocks as % of S&P 500

Top 10 Mega Cap Stocks as % of S&P 500 The growing dominance of the top 10 companies in the S&P 500 has raised concerns about whether the index still provides sufficient diversification, given the…

Median S&P 500 Performance After Fed Cuts Rates

Median S&P 500 Performance After Fed Cuts Rates The S&P 500 has typically risen by a median of roughly 50% in the two years after the Fed begins cutting rates. However, when cuts take place…

Amount of Fed Rate Cuts Priced by End of Year

Amount of Fed Rate Cuts Priced by End of Year The outlook could shift quickly in response to upcoming inflation data and changing economic conditions, but for now traders are pricing in 67 basis points…