Forecast – Federal Reserve Balance Sheet
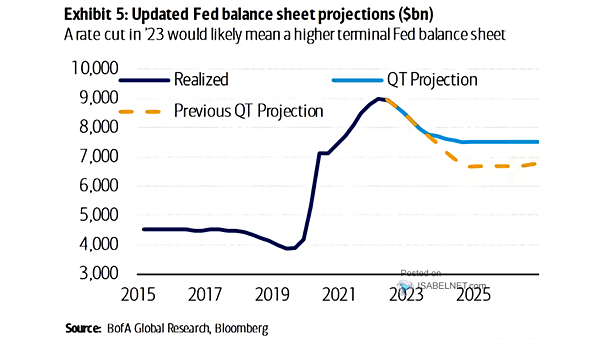
Forecast – Federal Reserve Balance Sheet Should investors expect a higher terminal Fed balance sheet? Image: BofA Global Research
Forecast – Federal Reserve Balance Sheet Should investors expect a higher terminal Fed balance sheet? Image: BofA Global Research
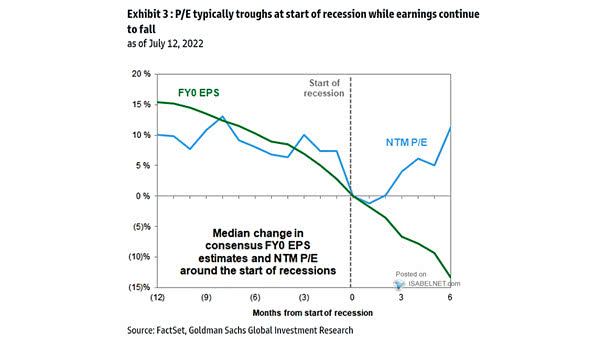
Median Change in Consensus FY0 EPS Estimates and NTM P/E Around the Start of Recessions Should equity investors expect earnings to fall, as recession fears mount? Image: Goldman Sachs Global Investment Research
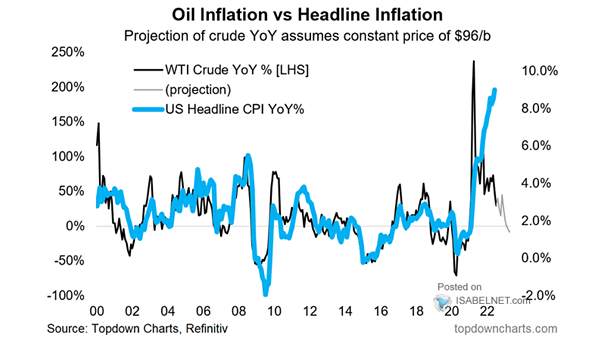
Oil Impact on U.S. Headline Inflation U.S. inflation is likely to come down, as oil prices tend to drive inflation. Image: Topdown Charts
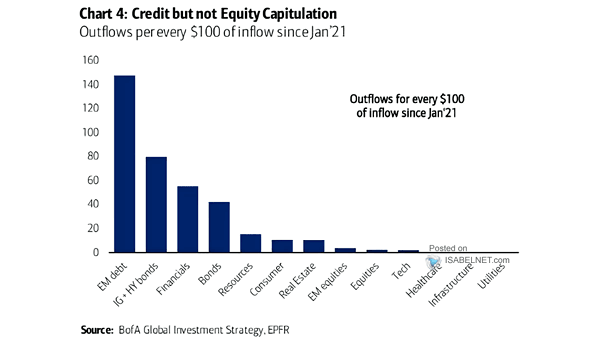
Flows – Outflows per Every $100 of Inflow Should investors stay cautious on equities, as capitulation has not been reached for risk assets? Image: BofA Global Investment Strategy
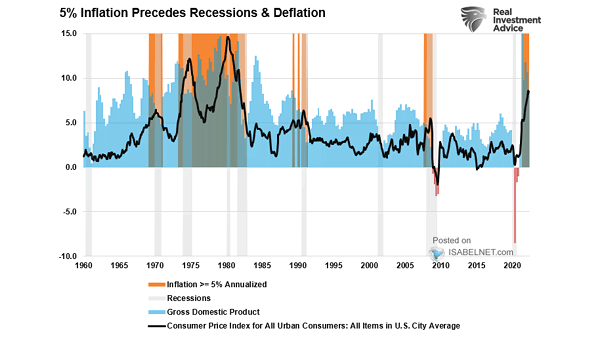
U.S. Inflation Above 5% and Recessions Historically, when inflation exceeds 5% on an annualized basis, a recession occurs in the United States. Is it really different this time? Image: Real Investment Advice
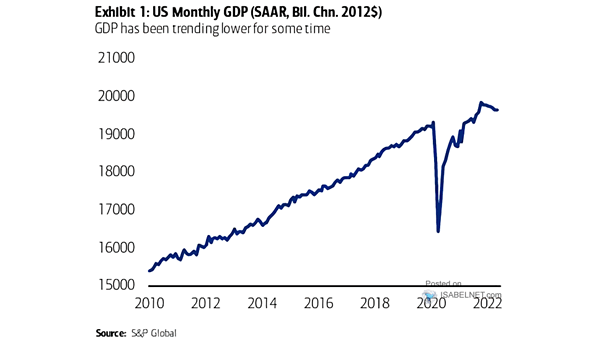
U.S. Monthly GDP BofA forecasts a mild recession in the United States, beginning in the second half of this year and expects 4Q/4Q real GDP to decline 1.4%. Image: BofA Global Research
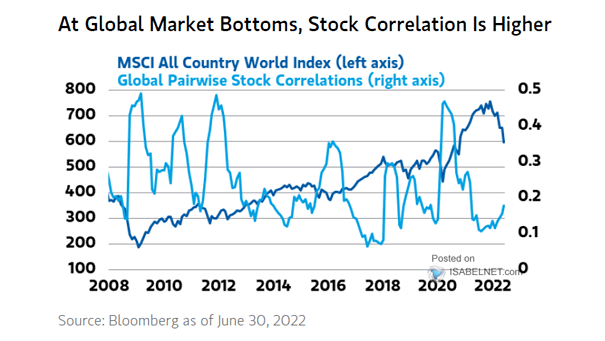
MSCI All Country World Index and Global Pairwise Stock Correlations The bear market bottom is probably not yet in, as stock correlation is higher at global market bottoms. Image: Morgan Stanley Wealth Management
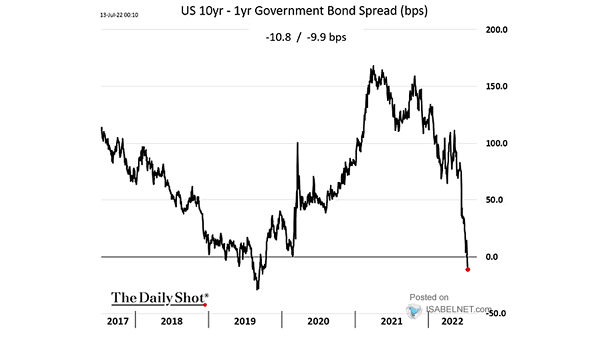
Yield Curve – U.S. 10-Year – 1-Year Government Bond Spread The 10Y-1Y yield curve inversion does not bode well for the U.S. economy. A recession in the United States is looking increasingly likely. Image: The…
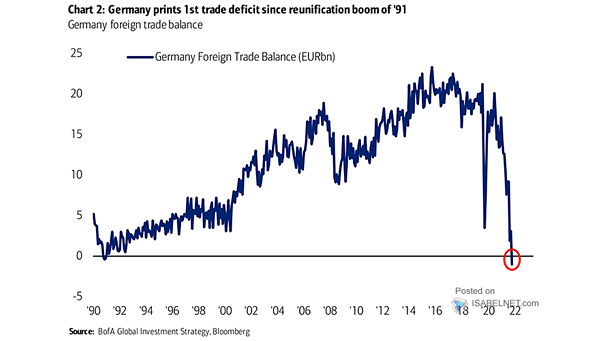
Germany Foreign Trade Balance Germany recorded its first trade deficit in goods since 1991. Could the euro fall further? Image: BofA Global Investment Strategy
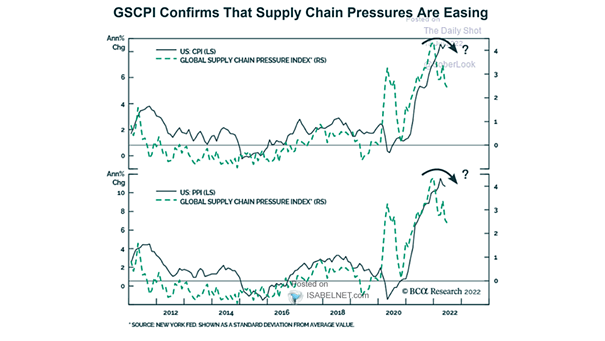
Inflation – U.S. CPI and PPI vs. Global Supply Chain Pressure Index Supply-chain pressures show signs of easing, which is good news for U.S. inflation. Image: BCA Research
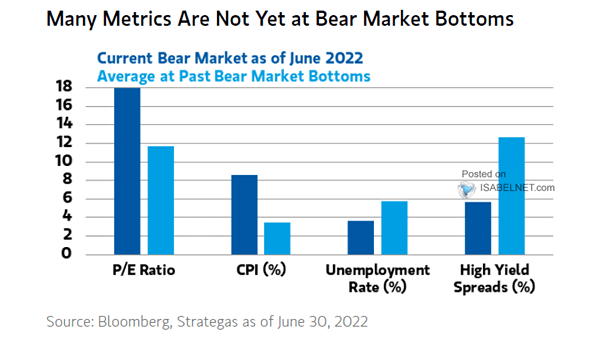
Average at Past Bear Market Bottoms The bottom of the bear market is probably not yet in. Image: Morgan Stanley Wealth Management