Size of S&P 500 10%+ Corrections
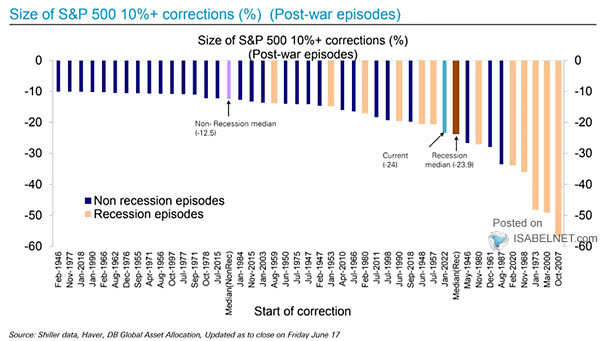
Size of S&P 500 10%+ Corrections It’s the 4th worst non-recessionary correction for the S&P 500 since World War II. Image: Deutsche Bank Asset Allocation
Size of S&P 500 10%+ Corrections It’s the 4th worst non-recessionary correction for the S&P 500 since World War II. Image: Deutsche Bank Asset Allocation
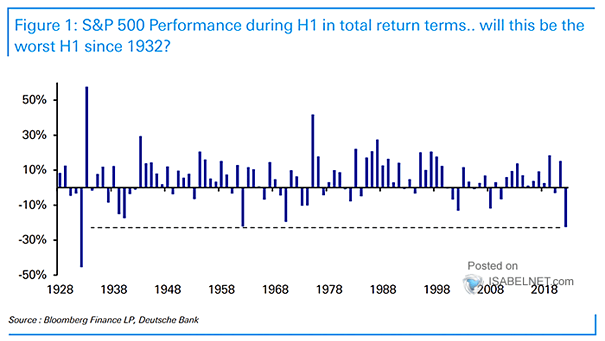
S&P 500 Performance During H1 in Total Returns Terms Will the S&P 500 recover in the second half of the year after a poor first half? Image: Deutsche Bank
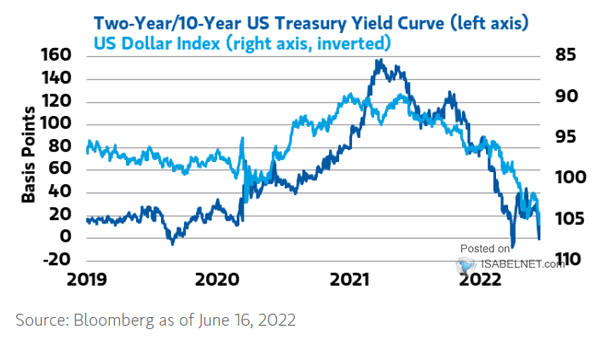
U.S. Dollar (Inverted) vs. 10Y-2Y U.S. Treasury Yield Curve Could the U.S. dollar increase the risk of recession in the United States? Image: Morgan Stanley Wealth Management
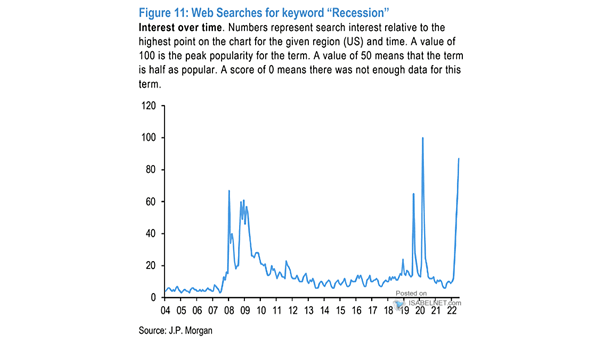
Web Searches for Keywords “Recession” The United States faces a growing risk of recession. Image: J.P. Morgan
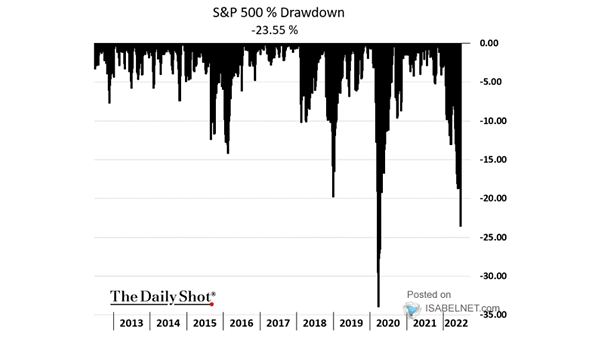
S&P 500 Drawdown Is the S&P 500 predicting a U.S. recession, as the Fed is more aggressive than expected? Image: The Daily Shot
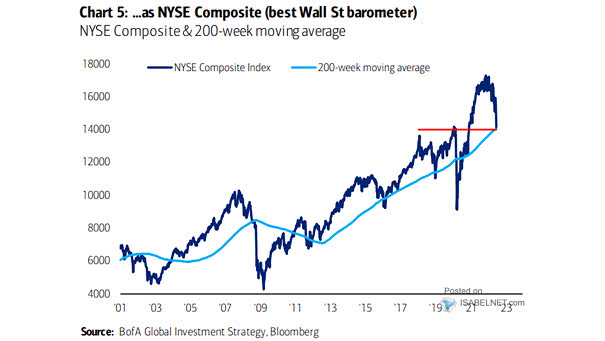
U.S. Stocks – NYSE Composite Could a break below 14,000 for the NYSE Composite Index intensify the sell-off toward the 2018 lows at 11,000? Image: BofA Global Investment Strategy
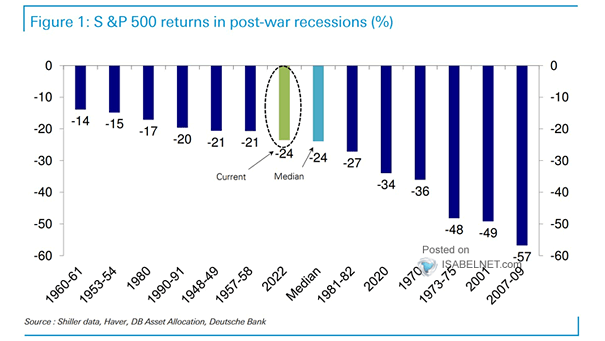
S&P 500 Returns in Post-War Recessions So far, the S&P 500 has discounted a mild recession in the United States. Image: Deutsche Bank Asset Allocation
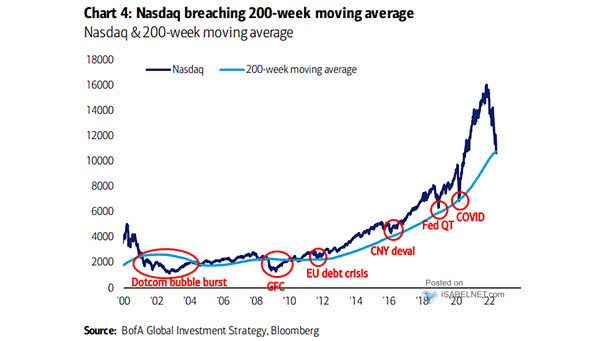
Nasdaq and 200-Week Moving Average How deeply will the Nasdaq drop below its 200-week moving average? Image: BofA Global Investment Strategy
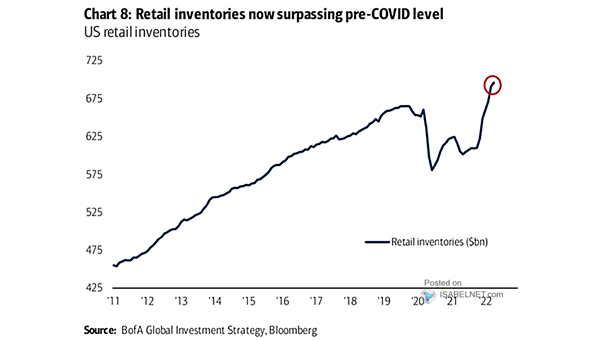
U.S. Retail Inventories Retail inventories in the United States continue to rise. Image: BofA Global Investment Strategy
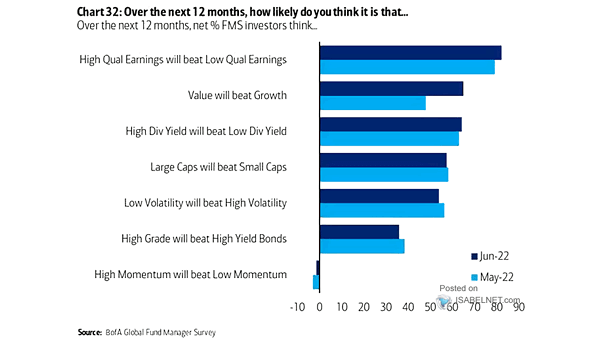
Performance – Over the Next 12 Months, Net % FMS Investors Think… Will high quality earnings beat low quality earnings over the next 12 months? Image: BofA Global Fund Manager Survey
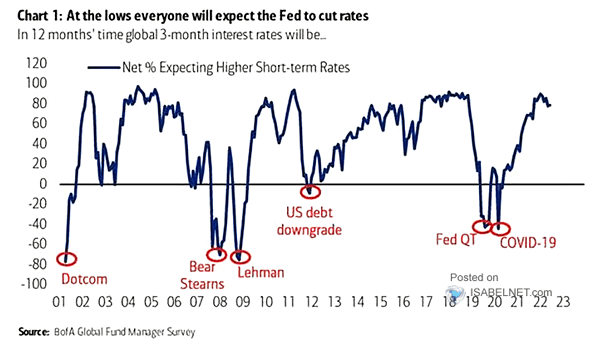
FMS Investors – Net % Expecting Higher Short-Term Rates At the market lows, investors will expect the Fed to cut rates. Image: BofA Global Fund Manager Survey