Net % OW Equities vs. Net % Expecting Stronger Economy
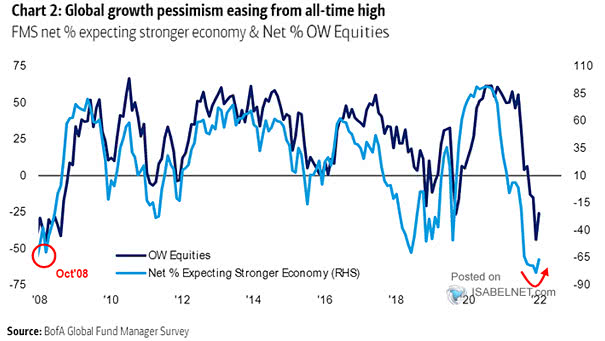
Net % OW Equities vs. Net % Expecting Stronger Economy Pessimism about global growth is easing, suggesting a higher net equity allocation. Image: BofA Global Fund Manager Survey
Net % OW Equities vs. Net % Expecting Stronger Economy Pessimism about global growth is easing, suggesting a higher net equity allocation. Image: BofA Global Fund Manager Survey
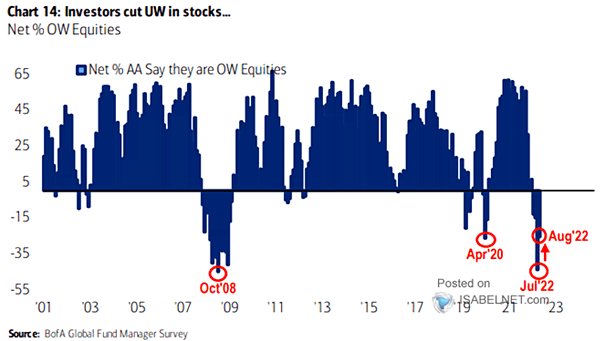
Net % OW Equities FMS investors cut their net underweight in stocks to -26% from -44%. Image: BofA Global Fund Manager Survey
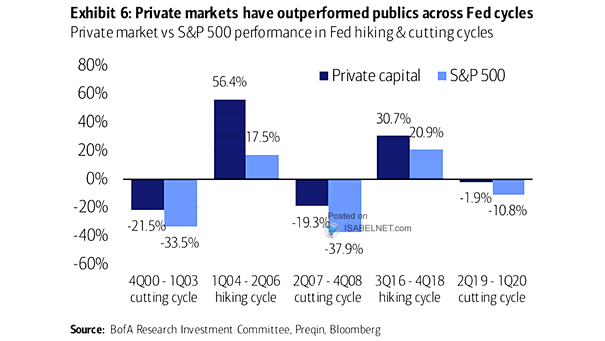
Private Market vs. S&P 500 Performance in Fed Hiking and Cutting Cycles Will private markets continue to outperform public markets? Image: BofA Research Investment Committee
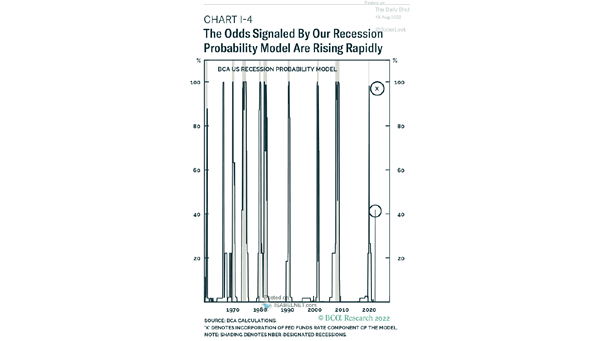
U.S. Recession Probability Model The odds of a recession in the United States continue to rise. Image: BCA Research
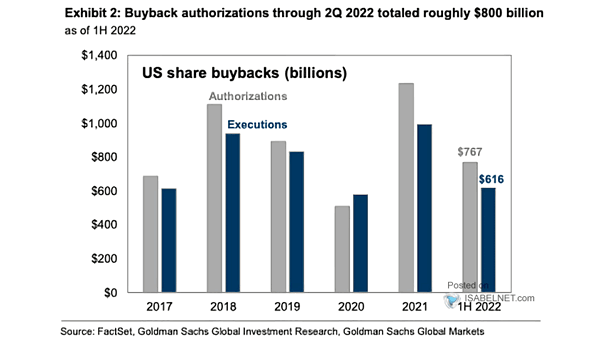
U.S. Share Buybacks Will U.S. share buybacks in 2022 surpass last year’s pace? Image: Goldman Sachs Global Investment Research
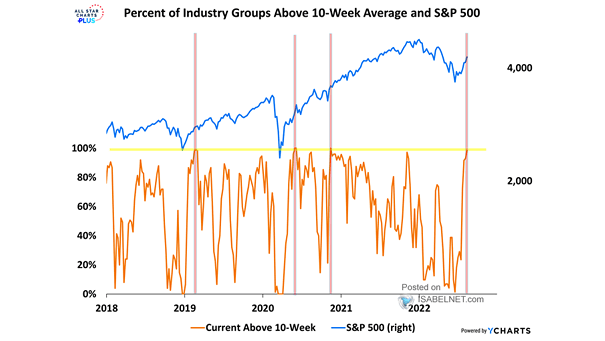
Percent of Industry Groups Above 10-Week Average and S&P 500 Is the current rally in U.S. equities more than just a bear market bounce, as 99% of industry groups are above their 10-week average? Image:…
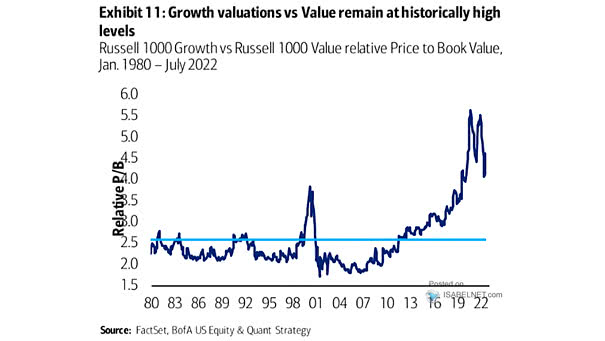
Valuation – Russell Growth vs. Russell Value Relative Price to Book Value Should U.S. equity investors continue to favor value over growth stocks? Image: BofA US Equity & Quant Strategy
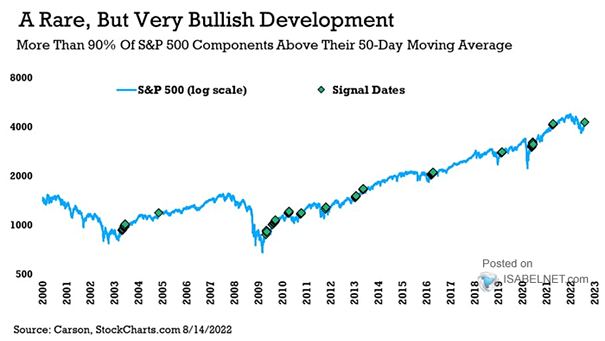
More than 90% of S&P 500 Components Above their 50-Day Moving Average Historically, more than 90% of S&P 500 components above their 50-day moving average tend to be bullish for U.S. stocks over 3, 6…
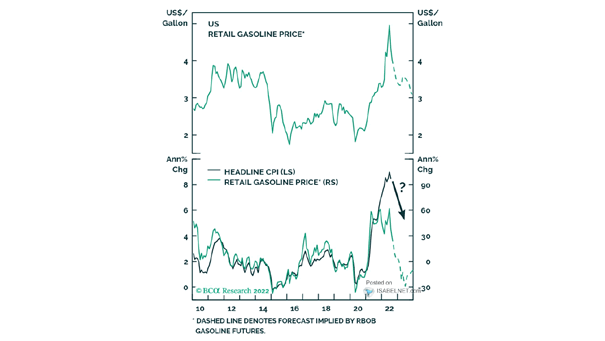
Inflation – U.S. Headline CPI and Retail Gasoline Price Should U.S. equity investors remain bullish as there is a high correlation between U.S. headline CPI and retail gasoline prices? Image: BCA Research
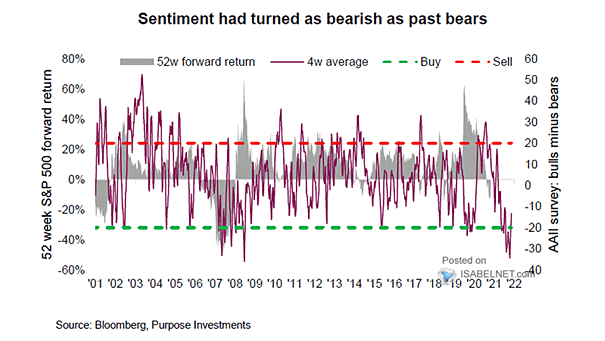
Sentiment – 52-Week S&P 500 Forward Return and AAII Survey Bulls Minus Bears Historically, when investor sentiment is very bearish, there is often a bounce in the stock market. Image: Richardson Wealth
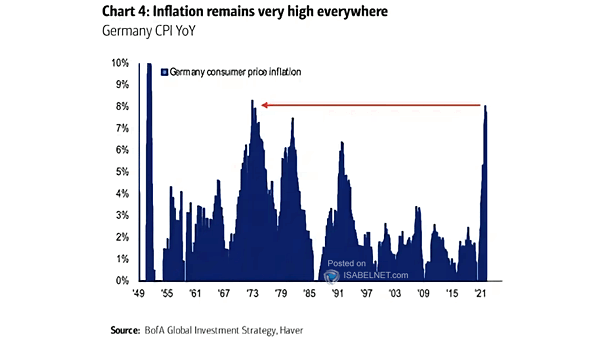
Inflation – Germany CPI YoY Has inflation in Germany peaked? Image: BofA Global Investment Strategy