S&P 500 Earnings Per Share and Recessions
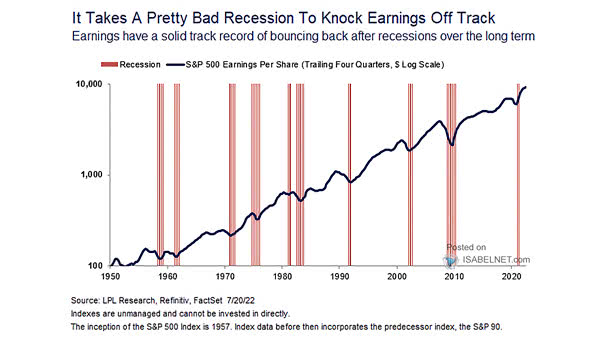
S&P 500 Earnings Per Share and Recessions Is pessimism justified when it comes to S&P 500 earnings? Image: LPL Research
S&P 500 Earnings Per Share and Recessions Is pessimism justified when it comes to S&P 500 earnings? Image: LPL Research
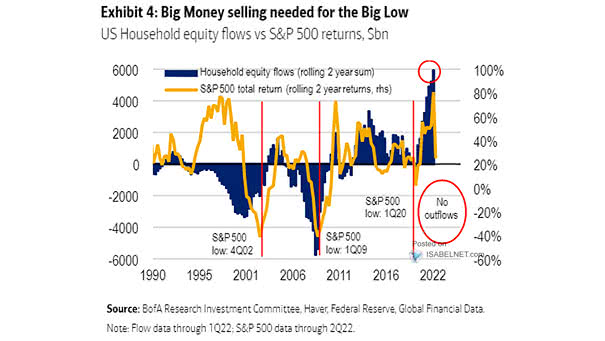
U.S. Household Equity Flows vs. S&P 500 Returns Historically, the S&P 500 tends to bottom only after large outflows from U.S. households. Image: BofA Research Investment Committee
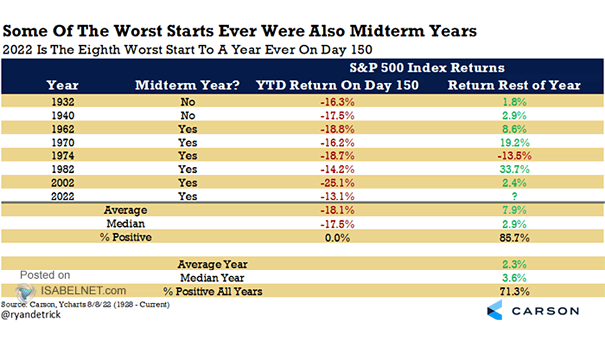
S&P 500 Index Returns – 2022 is the Eight Worst Strat to a Year Ever on Day 150 Could the S&P 500 recover its losses and finish the year in the green? Image: Carson Investment…
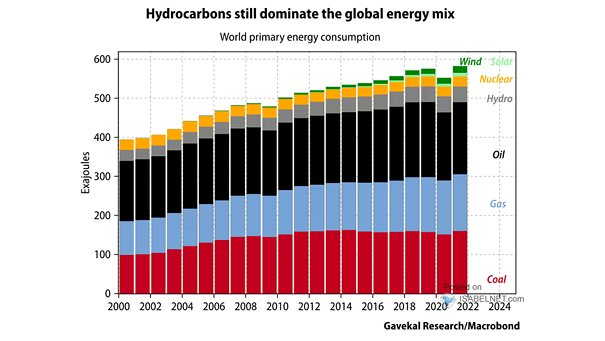
Oil – World Primary Energy Consumption Will oil continue to dominate primary energy consumption? Image: Gavekal, Macrobond
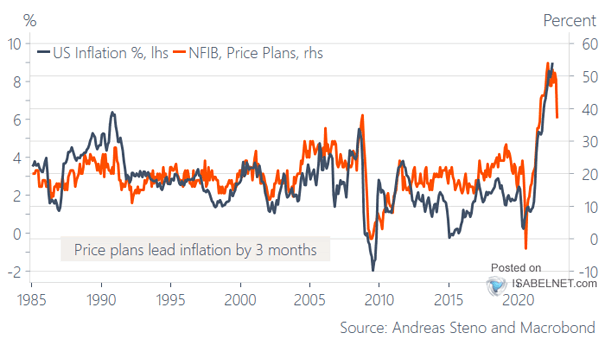
NFIB Price Plans and U.S. Inflation NFIB Price Plans tend lead U.S. inflation by 3 months. Image: Andreas Steno and Macrobond
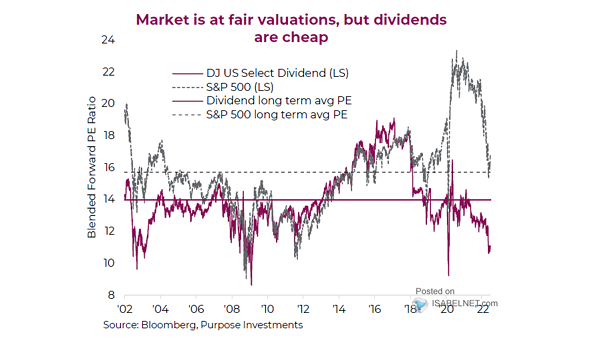
S&P 500 and Dow Jones U.S. Select Dividend Should investors favor U.S. dividend-paying stocks as valuations are attractive? Image: Richardson Wealth
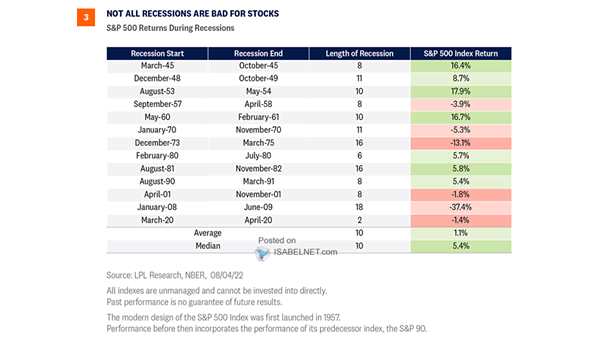
S&P 500 Return During Recessions Historically, a mild recession is not necessarily bad for U.S. stocks. Image: LPL Research
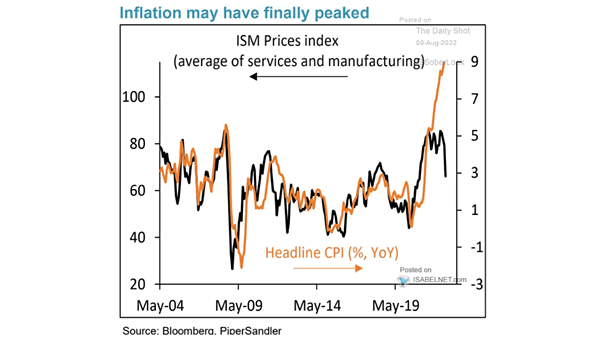
Inflation – ISM Prices Index vs. U.S. Headling CPI The ISM Prices Index suggests that U.S. inflation may have peaked. Image: Piper Sandler
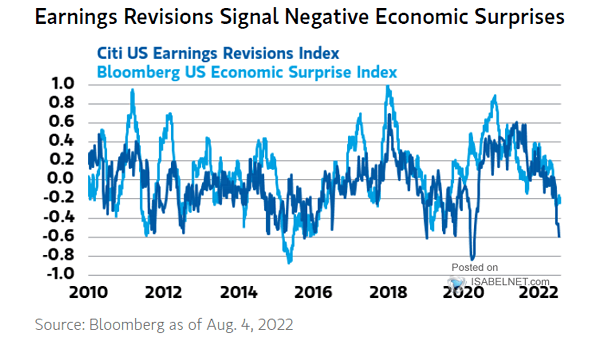
Citi U.S. Economic Surprise Index vs. S&P 500 12-Month Earnings Surprise U.S. earnings revisions suggest negative economic surprises. Image: Morgan Stanley Research
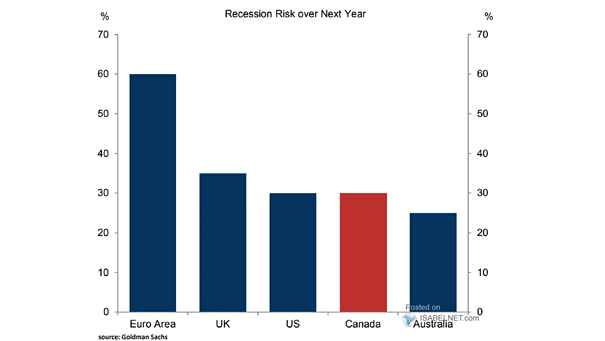
Recession Risk Over Next Year Goldman Sachs’s recession risk in the United States stands at 30% over the next year. Image: Goldman Sachs Global Investment Research
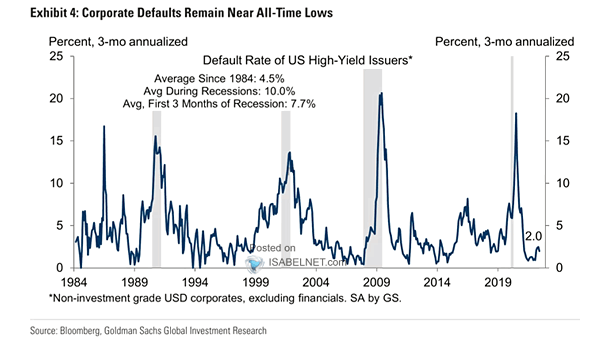
Default Rate of U.S. High-Yield Issuers U.S. corporate defaults are still near all-time lows, which is good news. Image: Goldman Sachs Global Investment Research