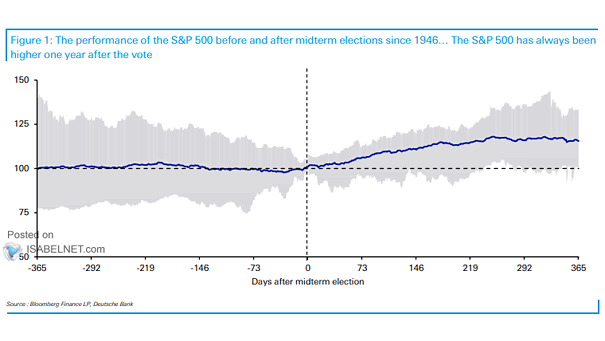
Seasonality – S&P 500 Index Average Monthly Returns

Seasonality – S&P 500 Index Average Monthly Returns March and April have a history of treating U.S. stocks well, as seasonal tailwinds lift sentiment. Maybe a dose of spring optimism is making the rounds on…

S&P 500 Price Reaction to Previous Military Escalations

S&P 500 Price Reaction to Previous Military Escalations The headlines may be dramatic, but the market impact is likely to be muted. U.S. equities wobble at first, then settle once investors refocus on fundamentals. In…

ISM Manufacturing Index vs. S&P 500 Index

ISM Manufacturing Index vs. S&P 500 Index U.S. factory activity expanded in February for the second straight month, with the ISM Manufacturing Index hitting 52.4 and easily beating forecasts for 51.5. That’s a good sign…

Valuation – S&P 500 NTM P/E

Valuation – S&P 500 NTM P/E With a forward P/E of 18 against 22 for the benchmark, the equal-weight index paints a clearer picture: valuations outside the tech giants look far less stretched. That gap…

Discretionary vs. Systematic Equity Positioning

Discretionary vs. Systematic Equity Positioning Systematic strategies hold steady at the 70th percentile, while discretionary investors remain cautious at the 31st percentile. Momentum could unlock more upside, but the trigger hasn’t pulled yet. Image: Deutsche…

AAII Asset Allocation

AAII Asset Allocation In February, U.S. retail investors dumped stocks, shifted into bonds, and cut cash holdings to their lowest since late 2021 as confidence in equities faded and markets braced for a bumpier spring.…

Insider Transactions Ratio

Insider Transactions Ratio Insider buying and selling have found equilibrium, with the Insider Transactions Ratio returning to neutral ground. This could mean that insiders are waiting for clearer market direction. Image: Barron’s

Risk Appetite Indicator

Risk Appetite Indicator Goldman Sachs’s Risk Appetite Indicator has dipped after recent events, holding just above neutral. Market participants are staying engaged, but with a careful hand. Image: Goldman Sachs Global Investment Research

Investor Sentiment – U.S. Market Greed/Fear Index

Investor Sentiment – U.S. Market Greed/Fear Index The Greed and Fear Index stands at 72.8, as retail traders are still all-in while pros quietly cut back. That mix could make for choppy trading and one-sided…