Russell 2000 Net Debt to Market Capitalization
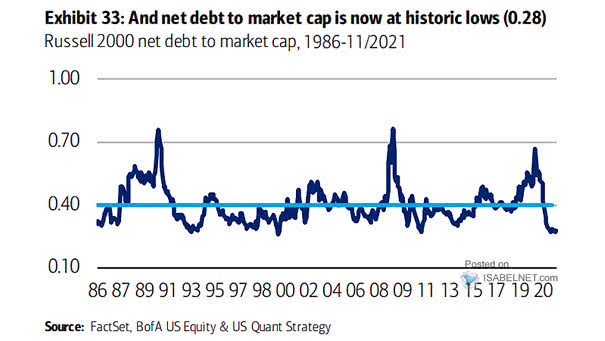
Russell 2000 Net Debt to Market Capitalization Russell 2000 net debt to market capitalization is at historic lows. Image: BofA US Equity & Quant Strategy
Russell 2000 Net Debt to Market Capitalization Russell 2000 net debt to market capitalization is at historic lows. Image: BofA US Equity & Quant Strategy
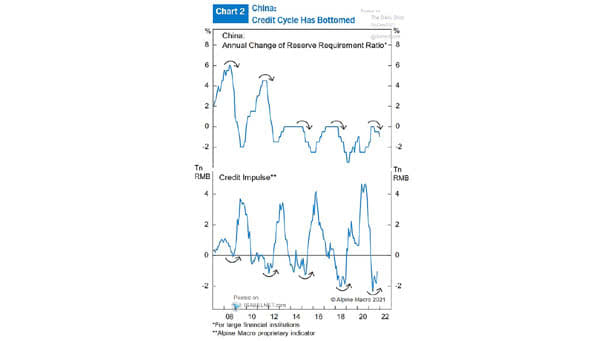
China Credit Impulse Investors should be pleased as Chinese credit stimulus is on the way. Image: Alpine Macro
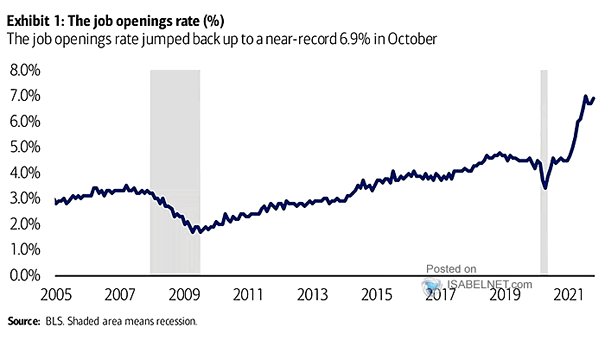
U.S. Job Openings Rate U.S. job openings are near record high, with 11 million open jobs in October, as hiring struggles persist. Image: BofA Global Research
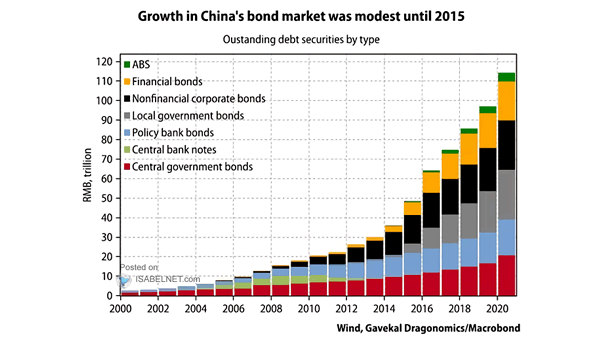
China’s Bond Market China’s bond market is growing fast. Image: Gavekal, Macrobond
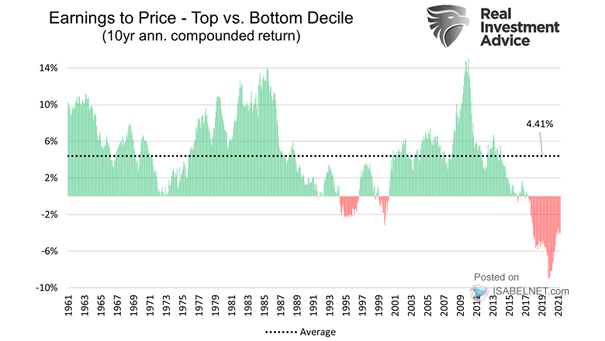
U.S. Earnings to Price – Top vs. Bottom Decile (10-Year Annual Compounded Return) When will value stocks outperform growth stocks again? Image: Real Investment Advice
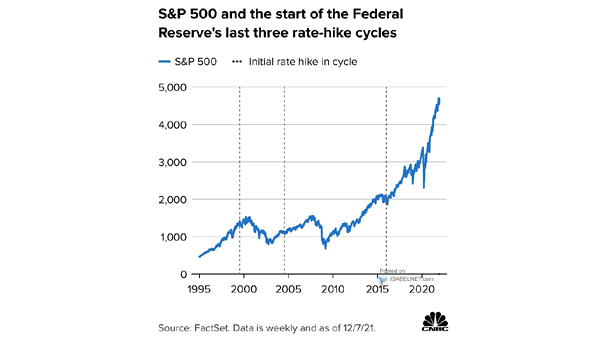
S&P 500 and the Start of the Federal Reserve’s Last Three Rate-Hike Cycles Should U.S. equity investors really fear rising interest rates? Image: CNBC
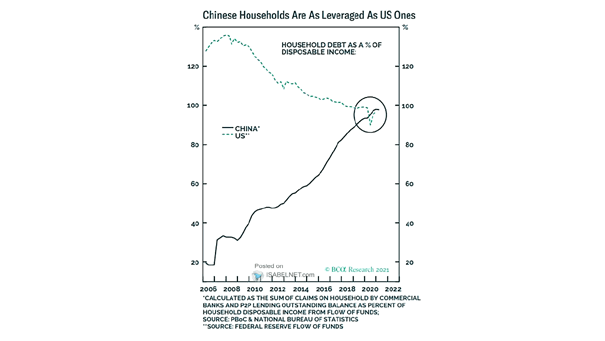
Household Debt as a % of Disposable Income China household debt is now greater than that of U.S. households. Image: BCA Research
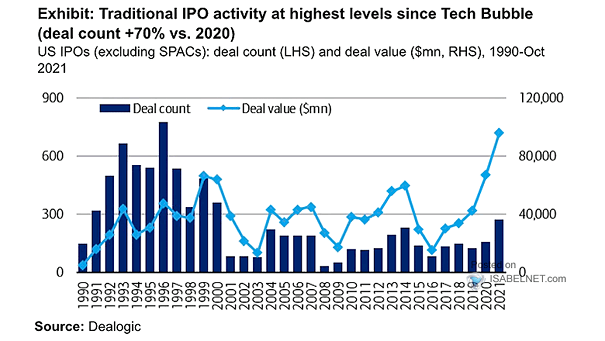
U.S. IPOs (Excluding SPACs) – Deal Count and Deal Value U.S. IPO activity is on the rise. Image: BofA Global Research
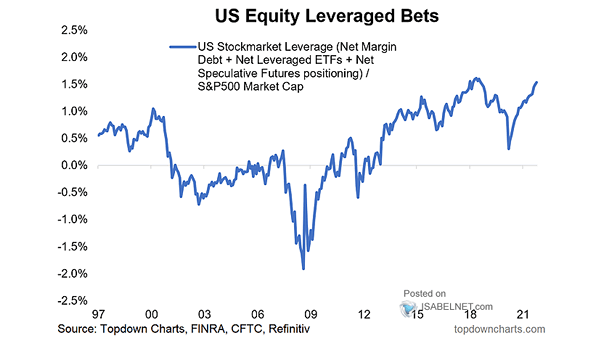
U.S. Stock Market Leverage / S&P 500 Market Capitalization U.S. stock market leverage as a percent of S&P 500 market capitalization continues to rise. Is it time for investors to be cautious? Image: Topdown Charts
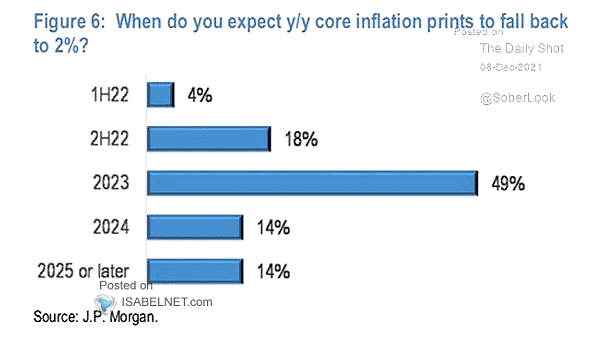
Survey – When Do You Expect Y/Y Core Inflation Prints Fall Back to 2%? Will core inflation prints fall back to 2% in 2023? Image: J.P. Morgan
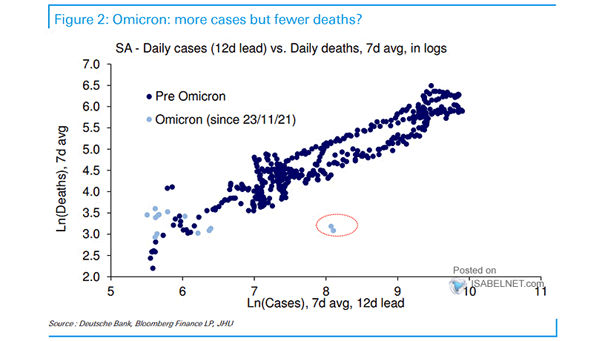
Coronavirus Omicron – Daily Cases vs. Daily Deaths in South Africa Is the new COVID variant Omicron less deadly than previous variants? Image: Deutsche Bank