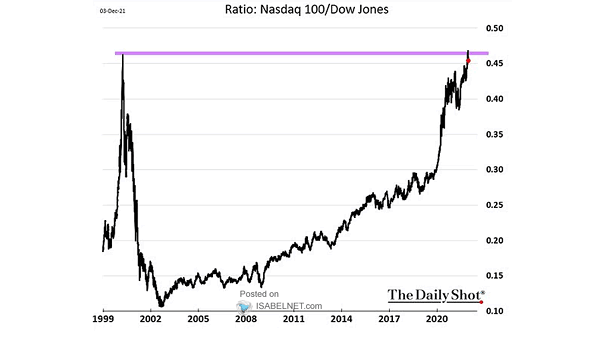
Performance – Ratio: Nasdaq 100/Dow Jones
Performance – Ratio: Nasdaq 100/Dow Jones How long will the Nasdaq 100 continue to outperform the Dow Jones? Image: The Daily Shot
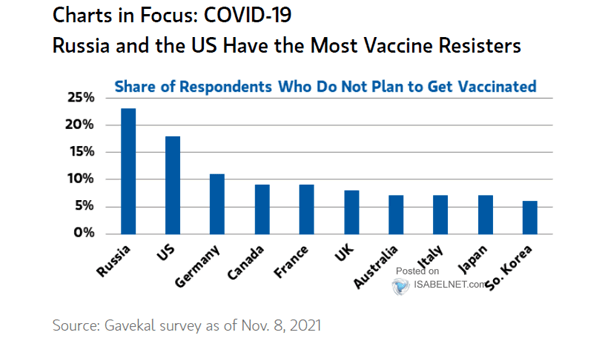
Coronavirus – Share of Respondents Who Do Now Plan to Get Vaccinated
Coronavirus – Share of Respondents Who Do Now Plan to Get Vaccinated Many Americans and Russians do not want to be vaccinated. Image: Morgan Stanley Wealth Management
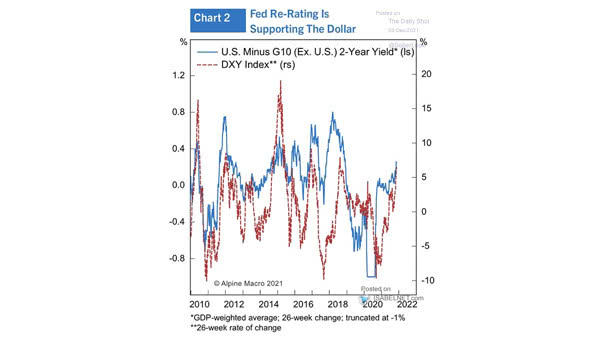
U.S. Dollar Index (DXY) vs. U.S. Minus G10 (Ex. U.S.) 2-Year Yield
U.S. Dollar Index (DXY) vs. U.S. Minus G10 (Ex. U.S.) 2-Year Yield Rising U.S. interest rates tend to make the U.S. dollar stronger. Image: Alpine Macro
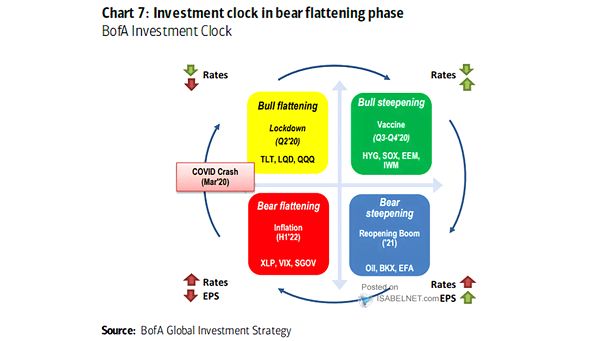
Markets – Investment Clock
Markets – Investment Clock The investment clock is in the bear flattening phase. Image: BofA Global Research
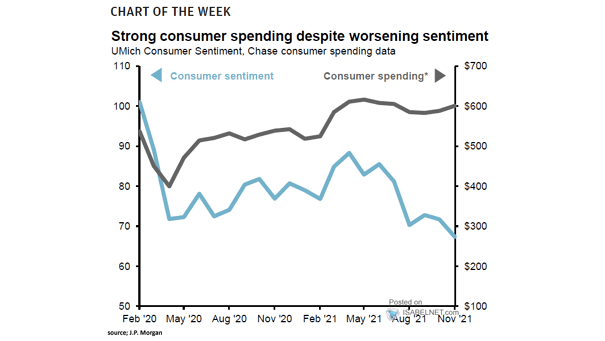
U.S. Consumer Sentiment vs. Consumer Spending
U.S. Consumer Sentiment vs. Consumer Spending Americans continue to spend despite rising prices. Image: J.P. Morgan Asset Management
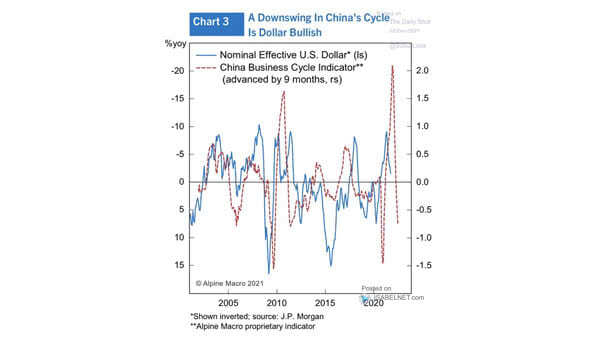
Nominal Effective U.S. Dollar and China Business Cycle Indicator (Leading Indicator)
Nominal Effective U.S. Dollar and China Business Cycle Indicator (Leading Indicator) China’s business cycle tends to lead the U.S. dollar by 9 months. Image: Alpine Macro
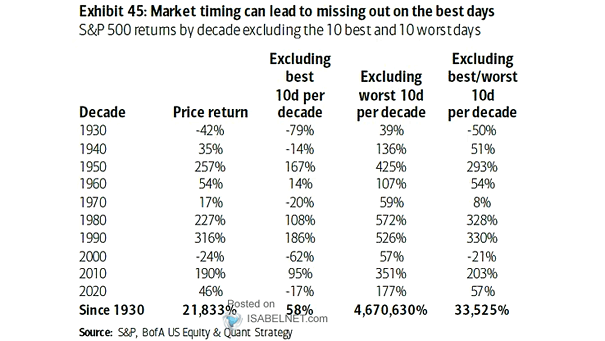
S&P 500 Returns by Decade Excluding the 10 Best and 10 Worst Days
S&P 500 Returns by Decade Excluding the 10 Best and 10 Worst Days Since 1930, if we exclude the best 10 days per decade, the S&P 500 return would be only 58%. Image: BofA US…
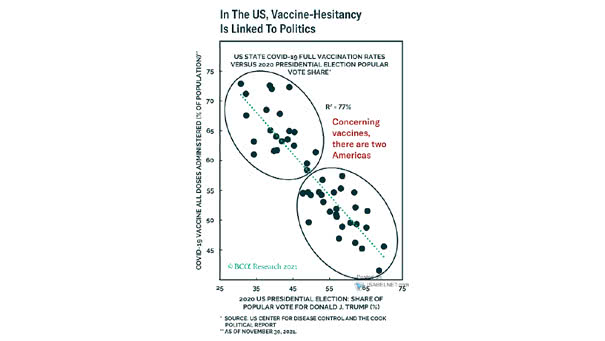
Coronavirus – U.S. State COVID-19 Full Vaccination Rates vs. 2020 Presidential Election Popular Vote Share
Coronavirus – U.S. State COVID-19 Full Vaccination Rates vs. 2020 Presidential Election Popular Vote Share Vaccination rates in the United States are highly correlated with politics. Image: BCA Research
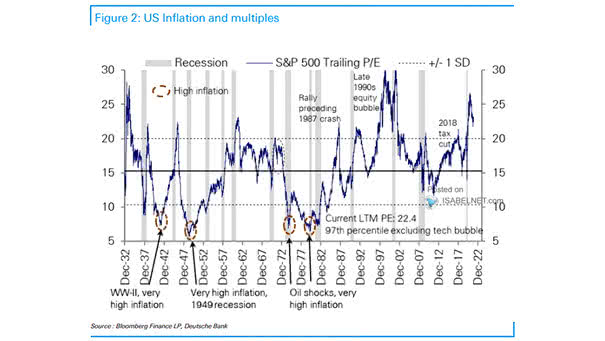
U.S. Inflation and S&P 500 Trailing P/E
U.S. Inflation and S&P 500 Trailing P/E Historically, when inflation is very high, the P/E multiple of the S&P 500 is very low. Image: Deutsche Bank
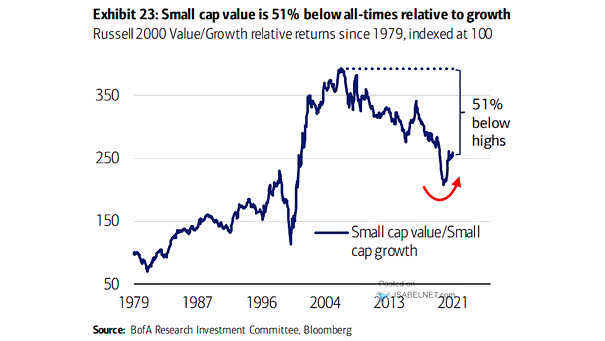
Russell 2000 Value/Growth Relative Returns
Russell 2000 Value/Growth Relative Returns Should investors favor small-cap value stocks over small-cap growth stocks? Image: BofA Research Investment Committee