U.S. 2/10 Yield Curve
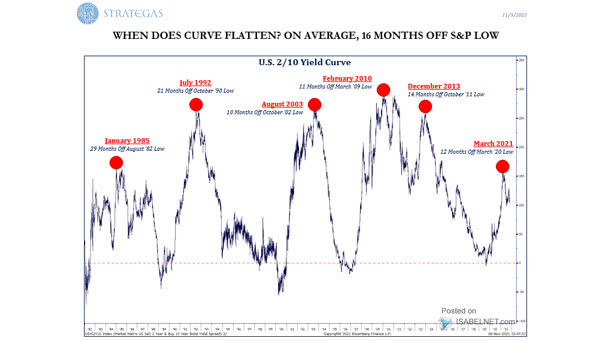
U.S. 2/10 Yield Curve Historically, the U.S. 2/10 yield curve tends to flatten on average 16 months after the S&P 500 low. Image: Strategas Research Partners
U.S. 2/10 Yield Curve Historically, the U.S. 2/10 yield curve tends to flatten on average 16 months after the S&P 500 low. Image: Strategas Research Partners
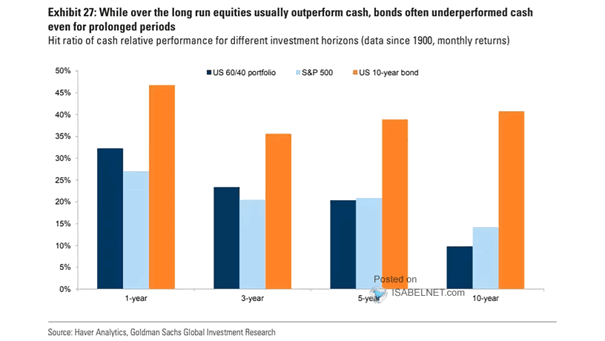
Hit Ratio of Cash Relative Performance for Different Investment Horizons Will bonds underperform cash? Image: Goldman Sachs Global Investment Research
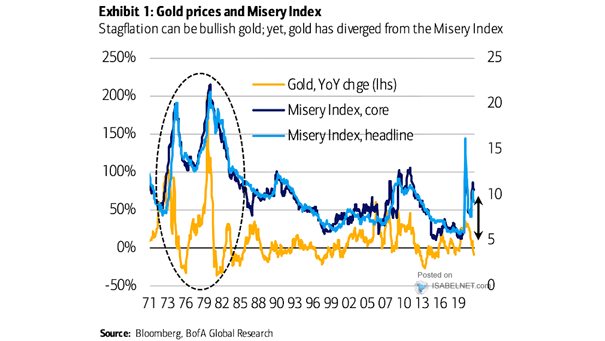
Gold and the Misery Index The divergence between gold and the misery index is widening. Image: BofA Global Research
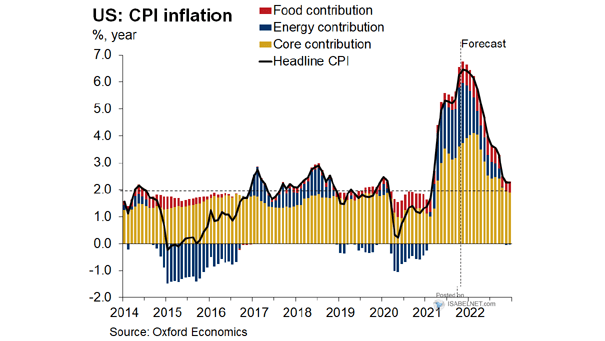
U.S. Headline CPI Inflation Forecast U.S. headline CPI inflation is expected to moderate sharply in early 2022. Image: Oxford Economics
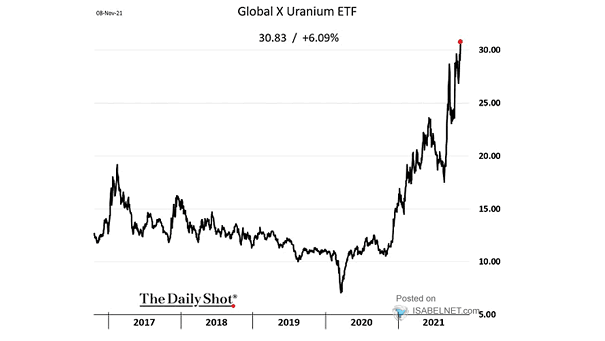
Performance – Global X Uranium ETF Are the stocks of companies involved in uranium mining on the way to the moon? Image: The Daily Shot
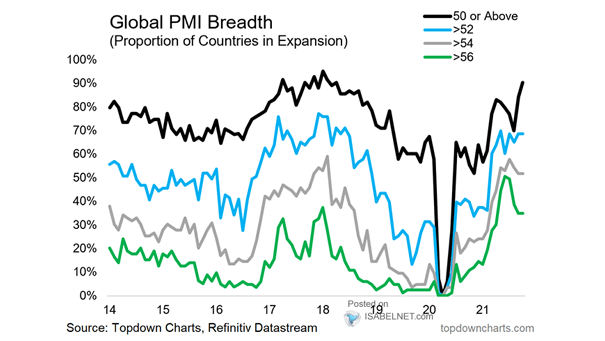
Global PMI Breadth Global PMI breadth is very impressive and encouraging. Image: Topdown Charts
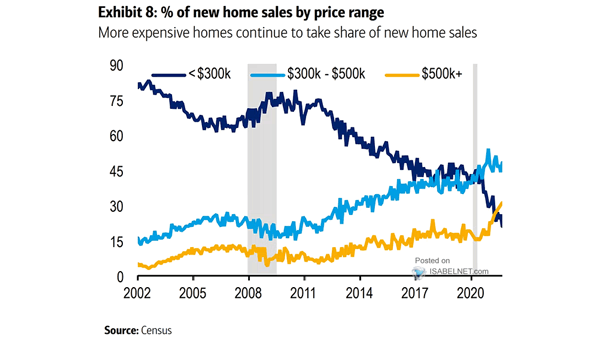
Housing – % of New U.S. Home Sales by Price Range The share of new home sales over $500,000 is increasing. Image: BofA Global Research
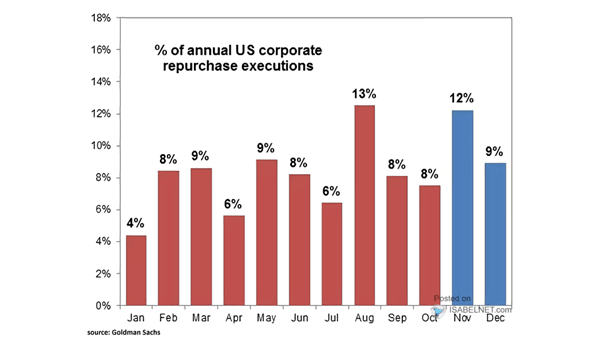
% of Annual U.S. Corporate Repurchase Executions November and December are good months for buyback executions, which is good news for U.S. stocks. Image: Goldman Sachs Global Investment Research
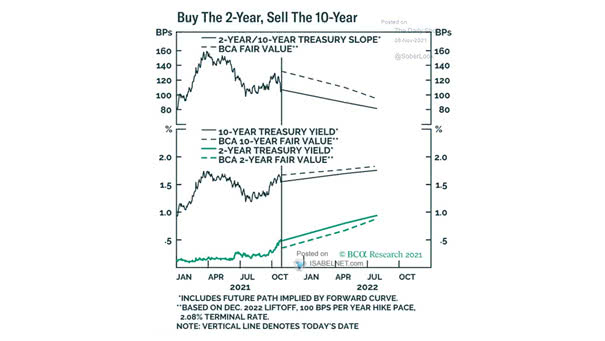
Yield Curve – 2-Year/10-Year U.S. Treasury Slope Will the U.S. Treasury yield curve continue to flatten? Image: BCA Research
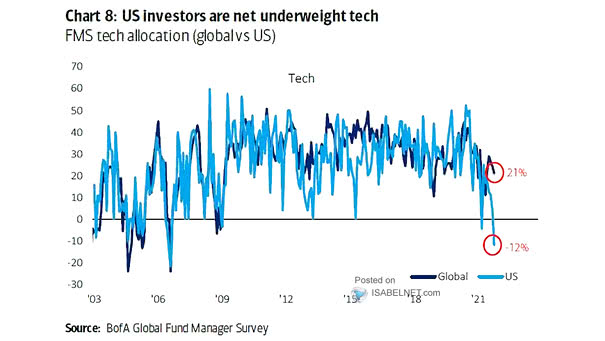
Tech Stocks – FMS Tech Allocation U.S. investors are net underweight in the technology sector, while global investors are net overweight in this sector. Image: BofA Global Fund Manager Survey
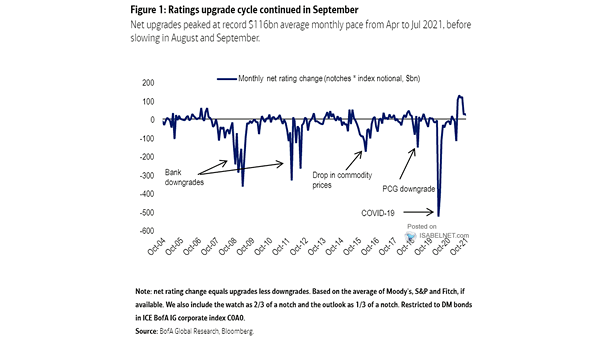
Monthly Net Rating Change The credit ratings upgrade cycle continued in September, which is good news for high yield investors. Image: BofA Global Research