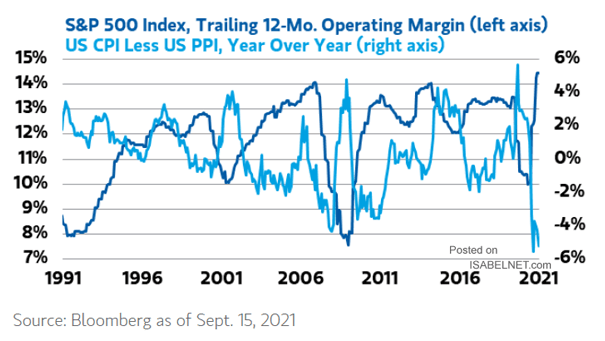
U.S. Real Potential GDP
U.S. Real Potential GDP U.S. real potential GDP growth is expected to fall to 1.5% from 1.7% today, due to ageing population. Image: Deutsche Bank
China – Total CO2 Emissions by Region China’s CO2 emissions continue to rise. Will China be carbon neutral by 2060? Image: Gavekal, Macrobond
China Credit Impulse Leads Global Manufacturing PMI China credit impulse tends to lead global manufacturing PMI by 12 months. Credit impulse is the change in new credit issued as a percentage of GDP. Image: Nordea and…
Performance – MSCI World Ex-U.S. and MSCI U.S. It has not paid to bet against U.S. stocks so far this year, as the gap between the U.S. stock market and stocks from the rest of…
S&P 500 Index Annualized Operating Leverage, Earnings Per Share Growth Less Sales Growth S&P 500 operating leverage is well above average. Is it sustainable? Image: Morgan Stanley Wealth Management
Coronavirus – Hospitalizations vs. Vaccinations The negative relationship between hospitalizations and vaccinations is significant (R² = 0.55). Image: BofA Global Research
Magnitude of S&P 500 Quarterly Earnings Beats (Misses) The S&P 500 is on pace for its best quarterly earnings growth since the global financial crisis. Image: BCA Research
S&P 500 – Average Recovery Days and Number of 2-Sigma Events The market recovery time has reached a new all-time low in 2021. Image: BofA Global Research
Share of Cash in Retail Transactions The use of cash in retail transactions is gradually declining. Image: Financial Times
Performance – U.S. IPOs and S&P 500 Could the poor performance of U.S. IPOs this year have a negative impact on upcoming listings? Image: Financial Times
NASDAQ 100 Index and Percent of Stocks Trading Above 50-Day Moving Average The NASDAQ breadth has not matched the rise in the index. Is it time to reduce exposure to tech stocks? Image: Morgan Stanley…