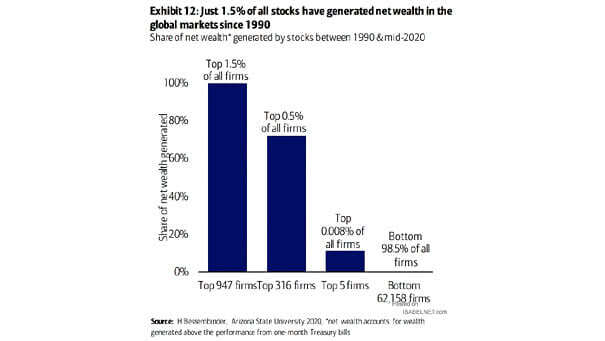
S&P 500 and VIX

S&P 500 and VIX The simultaneous rise in the VIX and the S&P 500 is unusual and a red flag. Image: BofA Global Research

S&P 500 – Historical Buy-The-Dip Trend

S&P 500 – Historical Buy-The-Dip Trend The buy-the-dip trend is declining, with the market recovery time reaching a new all-time low in 2021. Image: BofA Global Research

1-Month Correlation with the S&P 500

1-Month Correlation with the S&P 500 The equity/bond correlation has risen back above zero, driven by real rates. Image: Goldman Sachs Global Investment Research

U.S. Real GDP Growth Forecast

U.S. Real GDP Growth Forecast Is a period of inflation combined with a decline or stagnant U.S. GDP on the horizon? Image: BofA Global Investment Strategy

S&P 500 Seasonality Since 1985

S&P 500 Seasonality Since 1985 Chart showing the S&P 500 seasonality from 1985 to 2019. This is not a forecast. Image: Goldman Sachs Global Investment Research

U.S. Debt per Capita

U.S. Debt per Capita U.S. debt per capita is surging, reaching the current level of $82,000. Image: BofA Global Research