U.S., European, and Developed Ex-U.S. Equity Returns
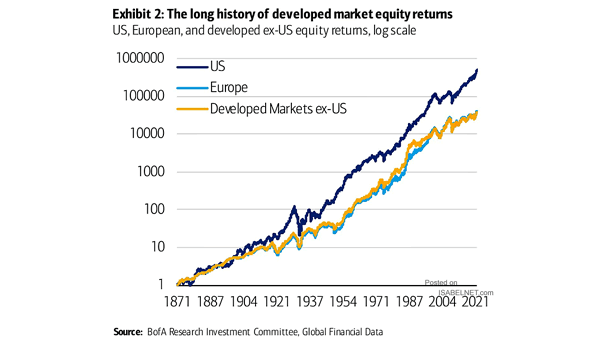
U.S., European, and Developed Ex-U.S. Equity Returns Will U.S. equities continue to outperform global equities ex-U.S.? Image: BofA Research Investment Committee
U.S., European, and Developed Ex-U.S. Equity Returns Will U.S. equities continue to outperform global equities ex-U.S.? Image: BofA Research Investment Committee
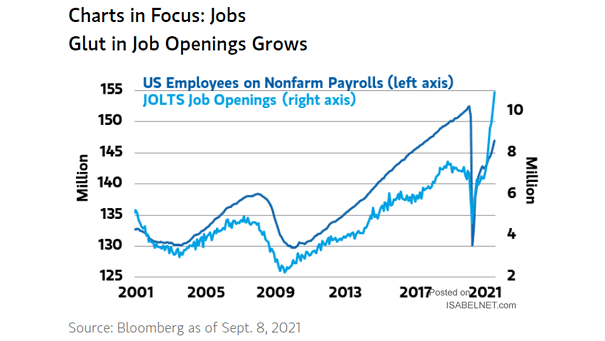
U.S. Employees on Nonfarm Payrolls and JOLTS Job Openings U.S. job openings hit another record high, as hiring struggles persist. Image: Morgan Stanley Wealth Management
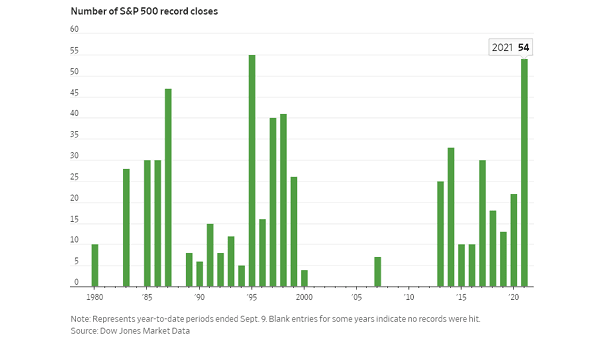
Number of S&P 500 Record Closes The S&P 500 has seen 54 record closes this year. Should investors expect more upside for U.S. equities in 2021? Image: The Wall Street Journal
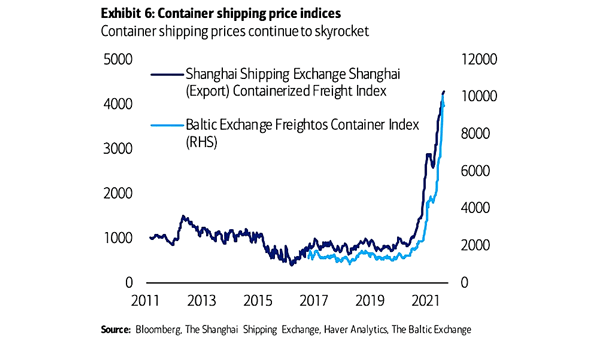
Inflation – Container Shipping Price Indices Container shipping prices are rocketing higher. Image: BofA Global Research
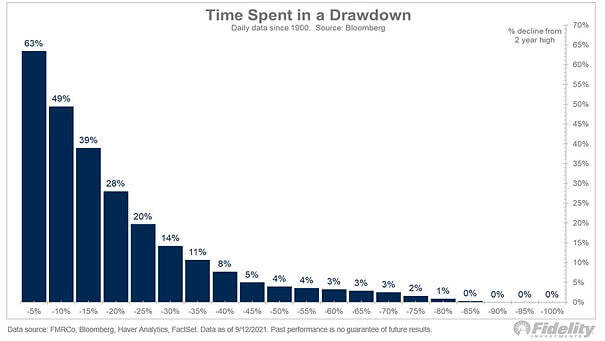
S&P 500 – Time Spent in a Drawdown Drawdowns don’t have a precise time to start or end and they happen all the time. The S&P 500 has spent 49% of its time in a…
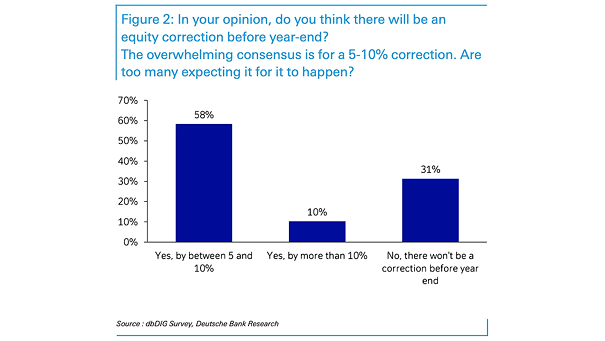
Survey – Do You Think There Will Be An Equity Correction Before Year-End? Should investors expect a 5-10% S&P 500 correction in 4Q21? Is the consensus right or wrong? Image: Deutsche Bank Research
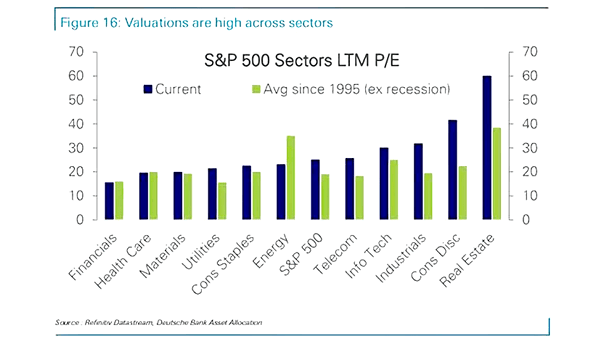
Valuation – S&P 500 Sectors LTM P/E Current valuations appear to be high across most sectors of the S&P 500. Are they justified? Image: Deutsche Bank Asset Allocation
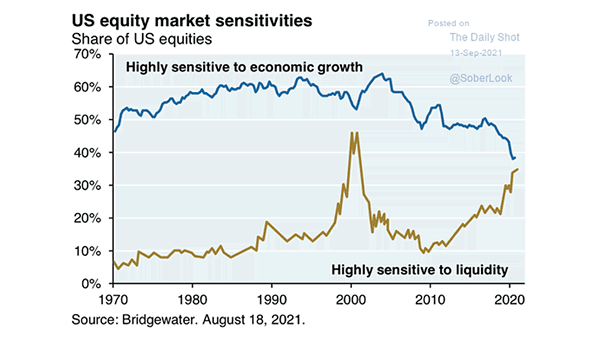
U.S. Equity Market Sensitivities How long will liquidity fuel the U.S. stock market rally? Image: The Wall Street Journal
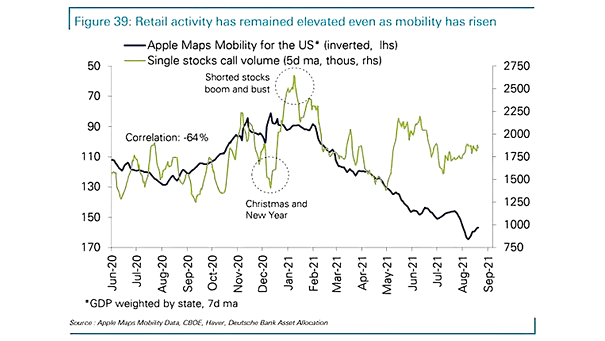
Retail Trading – Single Stocks Call Volume Will retail trading remain at a high level? Image: Deutsche Bank Asset Allocation
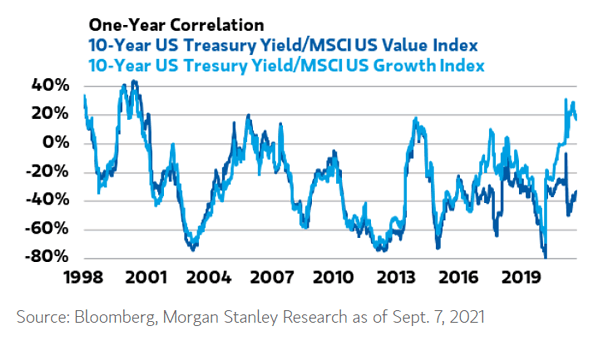
Growth Stocks – One-Year Correlation: 10-Year US Treasury Yield/MSCI Value Index vs. 10-Year US Treasury Yield/MSCI Growth Index U.S growth stocks are currently highly correlated with U.S. bond yields, as they were during the dotcom…
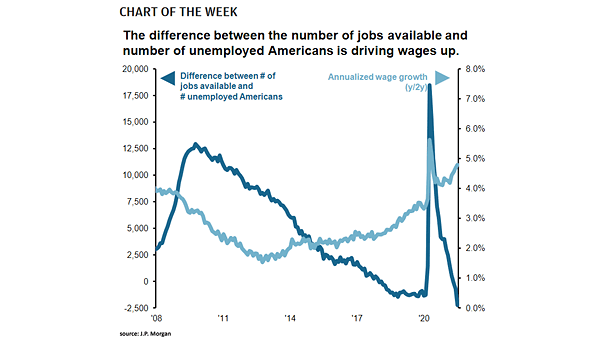
Difference Between Number of Jobs Available and Number of Unemployed Americans vs. Annualized Wage Growth U.S. wage growth is expected to remain strong in the short run. Image: J.P. Morgan Asset Management