U.S. Small Cap Fund Flows
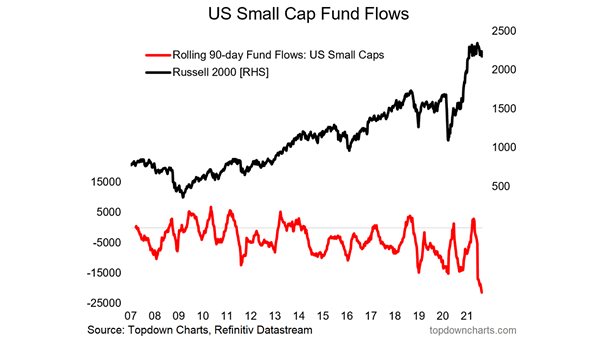
U.S. Small Cap Fund Flows Should investors be bullish on U.S. small caps despite record outflows? Image: Topdown Charts
U.S. Small Cap Fund Flows Should investors be bullish on U.S. small caps despite record outflows? Image: Topdown Charts
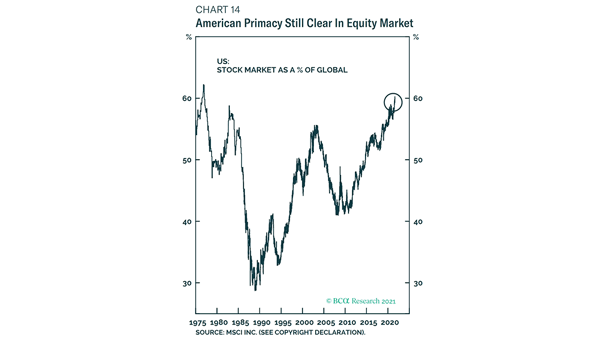
U.S. Stock Market as a % of Global U.S. stocks dominate global equity markets. Image: BCA Research
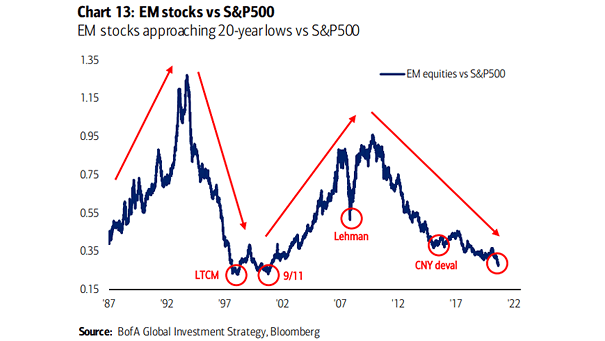
Emerging Market Equities vs. S&P 500 Emerging market equities look attractive relative to the S&P 500. Image: BofA Global Research
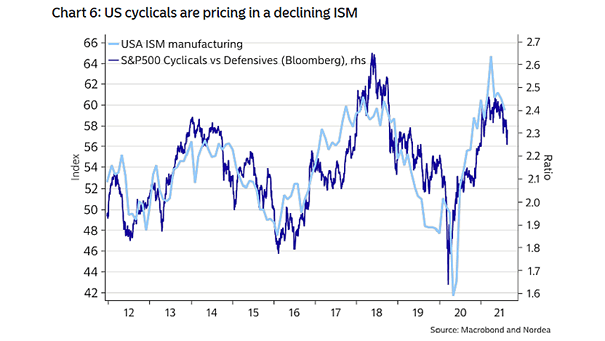
Cyclicals/Defensives vs. ISM Manufacturing PMI Should investors favor defensive stocks for the rest of the year? Image: Nordea and Macrobond
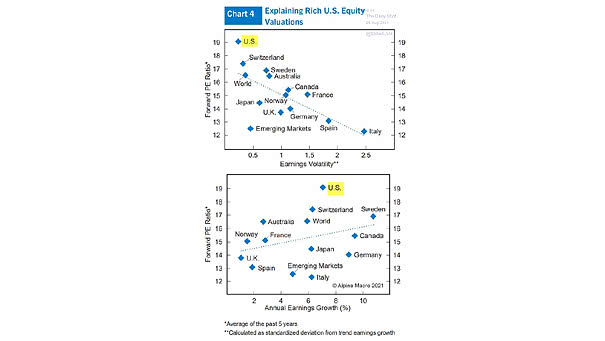
Valuations – Forward P/E Ratio and Earnings Volatility The U.S. equity market looks expensive. Should investors worry? Image: Alpine Macro
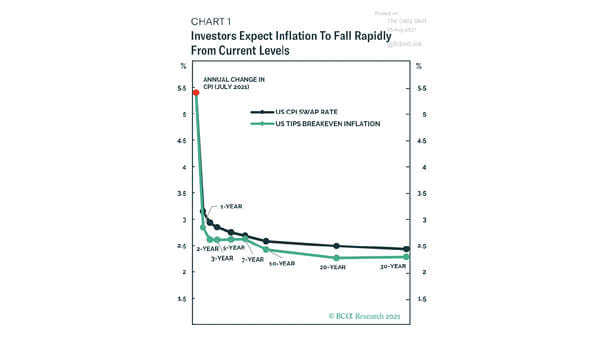
U.S. CPI Swap Rate and U.S. TIPS Breakeven Inflation Is U.S. inflation going to be transitory? Image: BCA Research
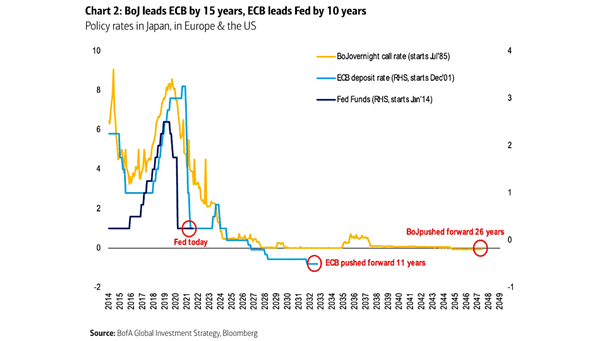
Policy Rates in Japan, in Europe and the U.S. Are ultra-low interest rates here to stay? Image: BofA Global Investment Strategy
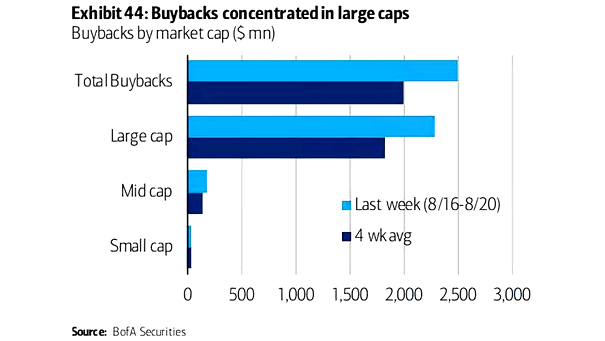
Buybacks by Market Capitalization Buybacks are currently driven by large caps. Image: BofA Securities
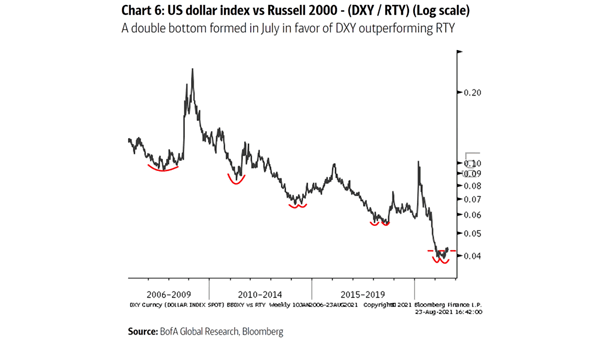
U.S. Dollar Index vs. Russell 2000 Will the U.S. dollar outperform the Russell 2000? Image: BofA Global Research
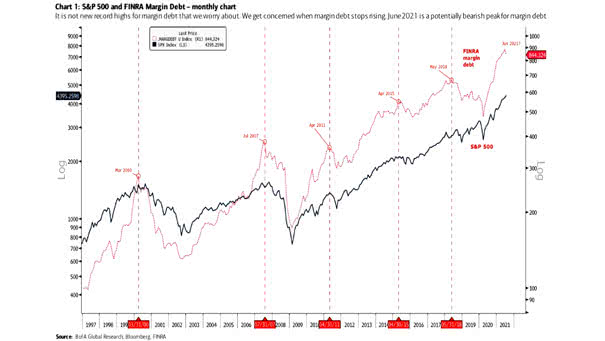
S&P 500 (Top) and Margin Debt (Bottom) In recent history, margin debt tends to peak in advance of highs in the S&P 500. Image: BofA Global Research Click the Image to Enlarge
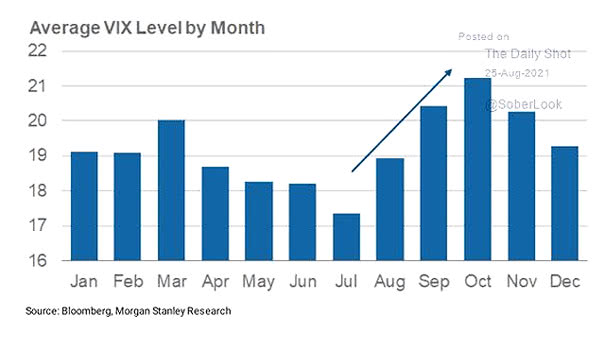
Seasonality – Average VIX Level by Month Historically, the August-October period tends to see increased risk of VIX spikes. Image: Morgan Stanley Research