Net Free Credit and the S&P 500
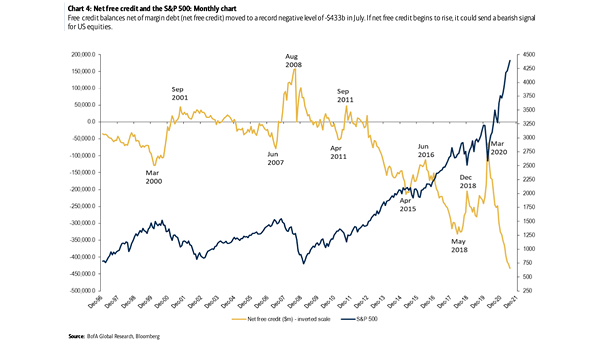
Net Free Credit and the S&P 500 Should equity investors worry about high leverage? Image: BofA Global Research
Net Free Credit and the S&P 500 Should equity investors worry about high leverage? Image: BofA Global Research
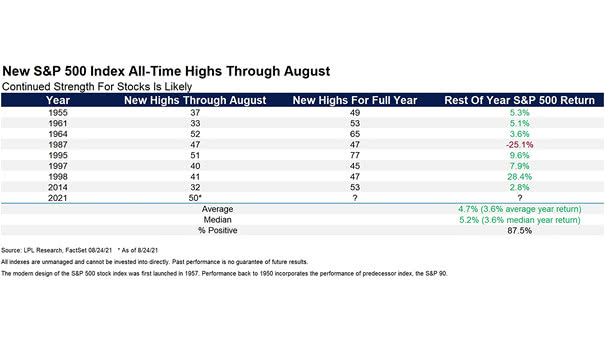
New S&P 500 Index All-Time Highs Through August Can equity investors expect further gains for the rest of the year? Image: LPL Research
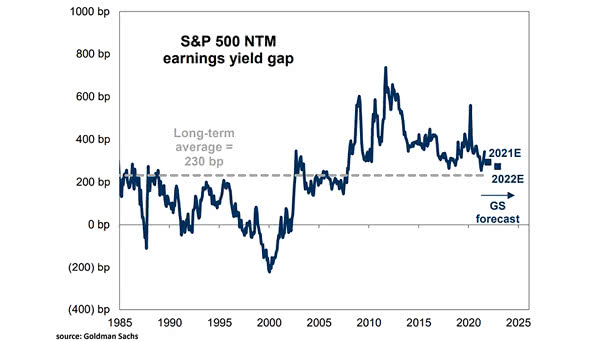
S&P 500 NTM Earnings Yield Gap The S&P 500 earnings yield gap is expected to move towards its long-term average. Image: Goldman Sachs Global Investment Research
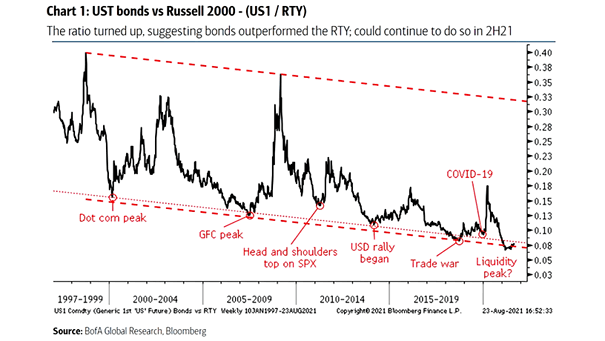
U.S. Treasury Bonds vs. Russell 2000 Will U.S. Treasury bonds continue to outperform the Russell 2000 for the rest of the year? Image: BofA Global Research
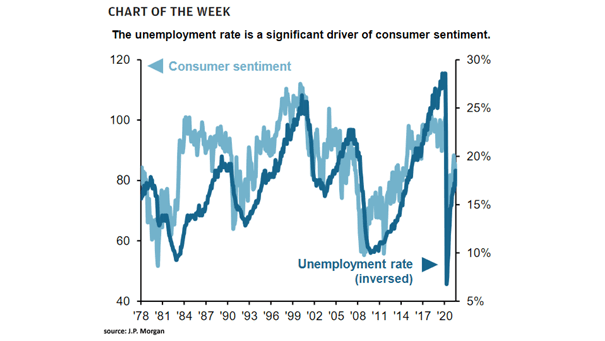
U.S. Consumer Sentiment and U.S. Unemployment Rate Consumer sentiment is a good leading indicator of the trend in the unemployment rate. Image: J.P. Morgan Asset Management
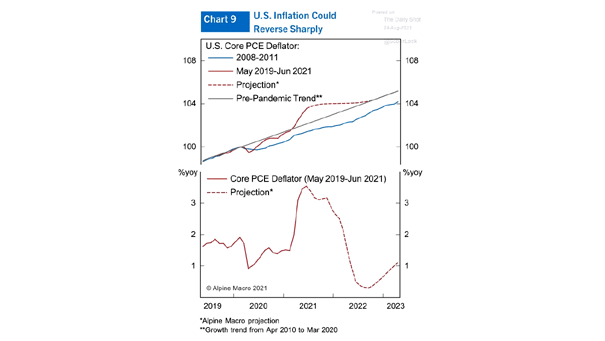
Inflation – U.S. Core PCE Deflator Are fears of high inflation overblown? Image: Alpine Macro
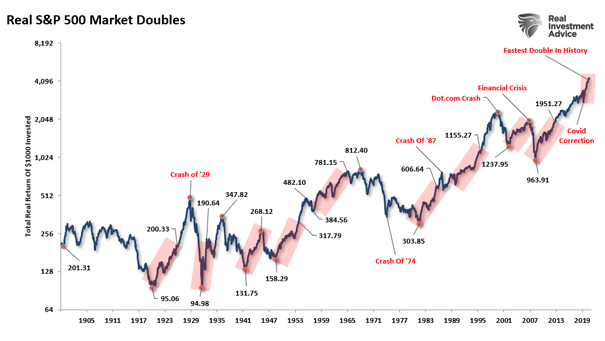
Real S&P 500 Market Doubles Is the U.S. stock market poised for a correction after 100% gain from its March 2020 low? Image: Real Investment Advice
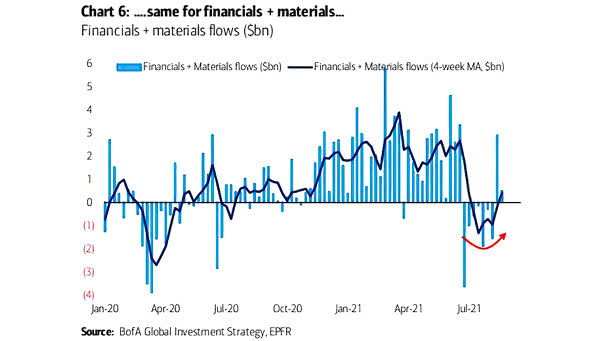
Financials and Materials Flows Investors are putting their money back into financials and materials. Image: BofA Global Research
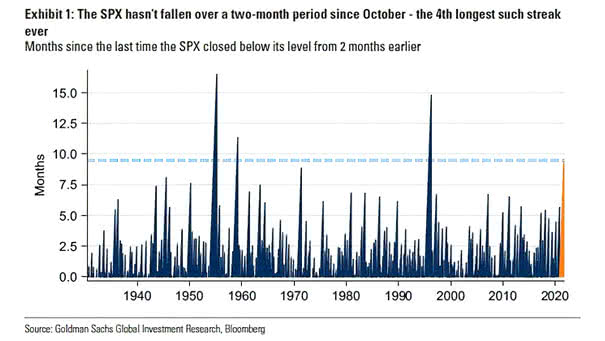
Months Since the Last Time the S&P 500 Closed Below Its Level from Two Months Earlier Is a pullback in U.S. stocks approaching? Image: Goldman Sachs Global Investment Research
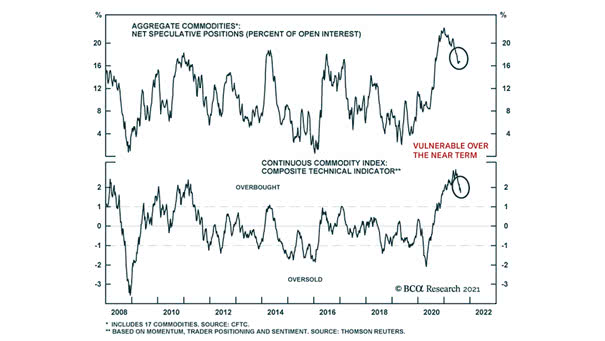
Commodities – Net Speculative Positions and Continuous Commodity Index Commodities remain vulnerable over the near term. Image: BCA Research
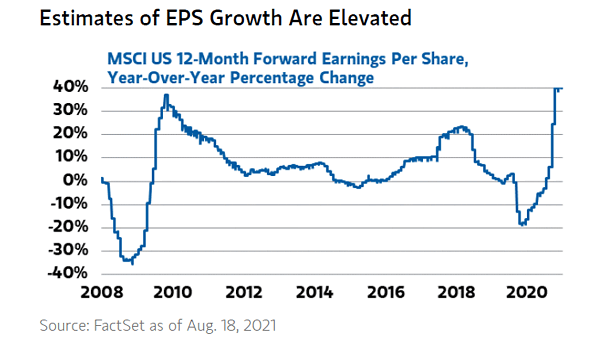
EPS Growth – MSCI U.S. 12-Month Forward Earnings per Share Estimates of EPS growth continue to hold up well. Image: Morgan Stanley Wealth Management