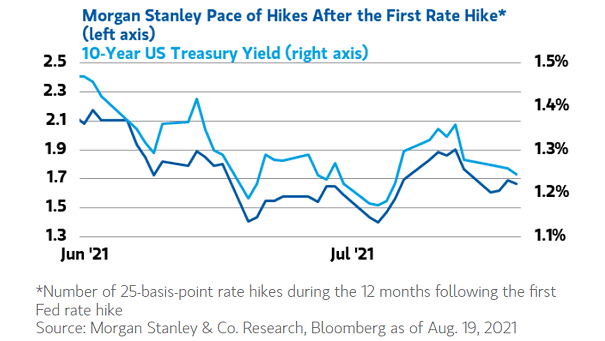
Equity/Bond Performance – Stock-to-Bond Ratio
Equity/Bond Performance – Stock-to-Bond Ratio The S&P 500 total return divided by total return in U.S. 10-year Treasury bonds is at an extreme level. Image: Alpine Macro
Valuation – High Quality Stocks vs. Russell 1000 High quality stocks look cheap relative to the broad market. Image: Financial Times
Interest Rates – Federal Funds Target Rate The Fed funds rate has declined over time and could peak at 150bp in the coming cycle. Image: Nordea and Macrobond
Valuation – U.S. 10-Year Real Yield and MSCI World Index Forward Price/Earnings Ratio The price of global equities is expected to fall, if U.S. real yields rise. Image: Morgan Stanley Wealth Management
SPY S&P 500 ETF – Day vs. Night Price Returns The S&P 500 loves the night. Since 1993, the real profits have been made outside regular trading hours. Image: Lohman Econometrics
Housing – House Price Index This is the fourth housing boom since 1970. Image: BofA Global Investment Strategy
Economic Surprises Index – China vs. G10 Economies Will G10 economies follow China? Image: BCA Research
Rates Volatility Rates volatility has increased again. Image: Goldman Sachs Global Investment Research
ISM PMI vs. S&P 500 Markets tend to lead the macro for most time periods. Image: BofA Global Investment Strategy
U.S. GDP – Biden Spending Proposals and Congress Congress should approve at least 1% in GDP of Biden spending proposals. Image: Goldman Sachs Global Investment Research
% of Stocks Above 50-Day Moving Average When S&P 500 At Record Narrow breadth in S&P 500 could suggest below average market returns. Image: Bloomberg