Breadth – % of Stocks in Nasdaq Above 50-Day Moving Average
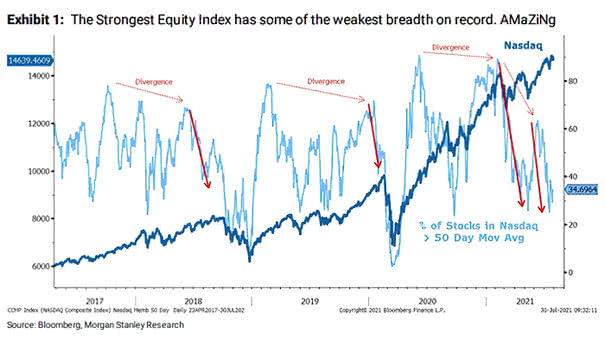
Breadth – % of Stocks in Nasdaq Above 50-Day Moving Average Is it time to reduce exposure to tech stocks, as the Nasdaq breadth has not matched the rise in the index? Image: Morgan Stanley…
Breadth – % of Stocks in Nasdaq Above 50-Day Moving Average Is it time to reduce exposure to tech stocks, as the Nasdaq breadth has not matched the rise in the index? Image: Morgan Stanley…
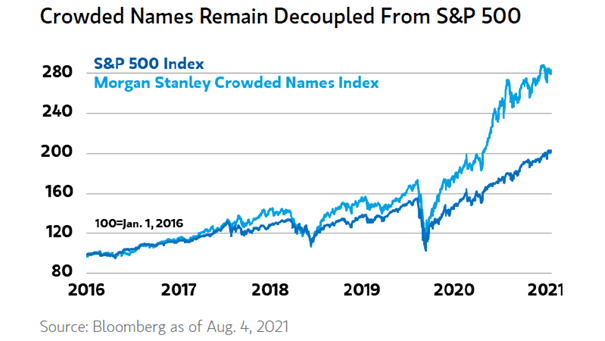
Returns – S&P 500 Index and Crowded Names The gap between the S&P 500 Index and crowded names has been widening since 2020. Image: Morgan Stanley Wealth Management
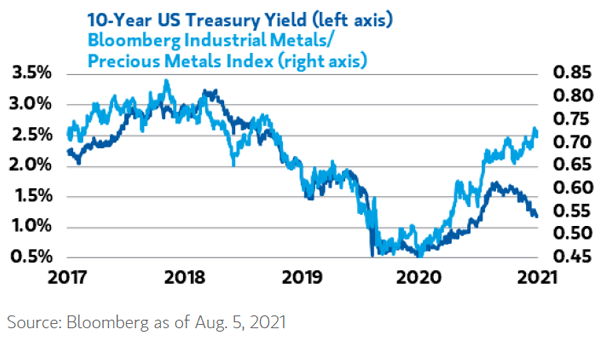
U.S. 10-Year Treasury Yield and Industrial Metals/Precious Metals Index Historically, U.S. rates tend to rise when growth is strong, as it is today. Image: Morgan Stanley Wealth Management
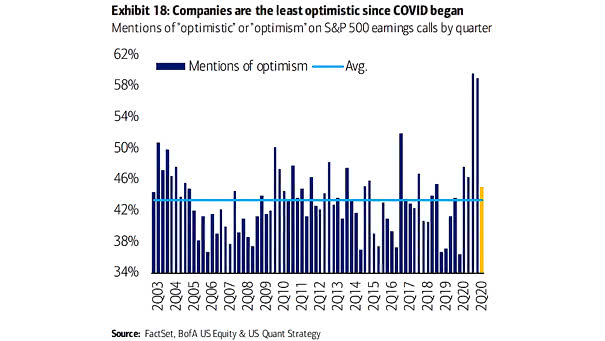
Mention of “Optimistic” or “Optimism” on S&P 500 Earnings Calls by Quarter S&P 500 companies are becoming less optimistic. Image: BofA US Equity & Quant Strategy
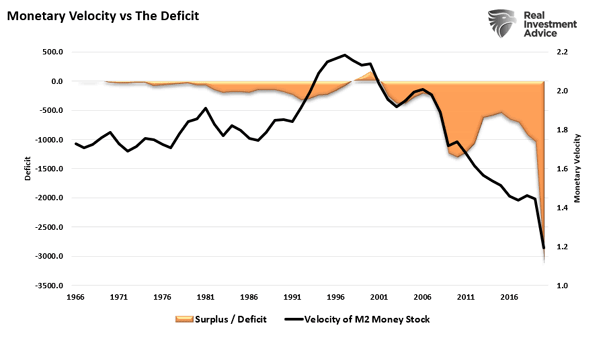
Velocity of M2 Money Stock in the U.S. vs. The U.S. Deficit The rise in the U.S. deficit has coincided with a collapse in M2 velocity. Image: Real Investment Advice
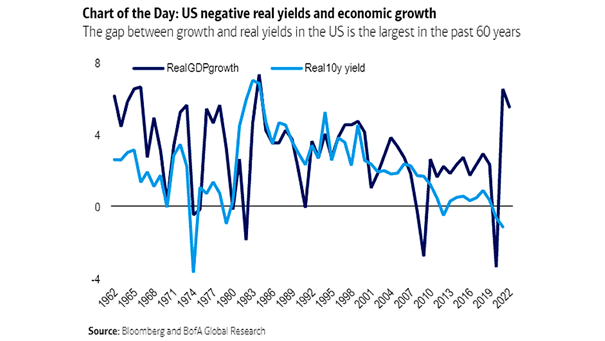
Real U.S. 10-Year Yield and U.S. Real GDP Growth Will U.S. real yields remain negative despite a strong U.S. economic recovery? Image: BofA Global Research
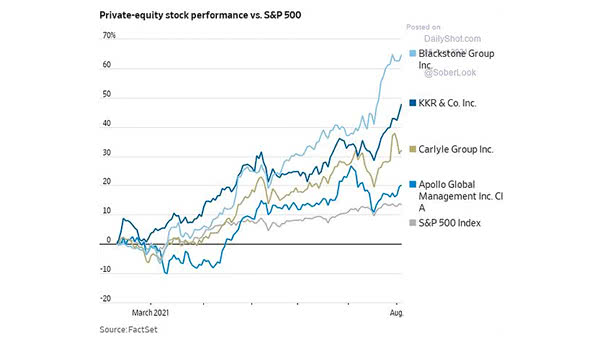
Private-Equity Stock Performance vs. S&P 500 Thanks to low interest rates, private equity returns are rising. Image: The Wall Street Journal
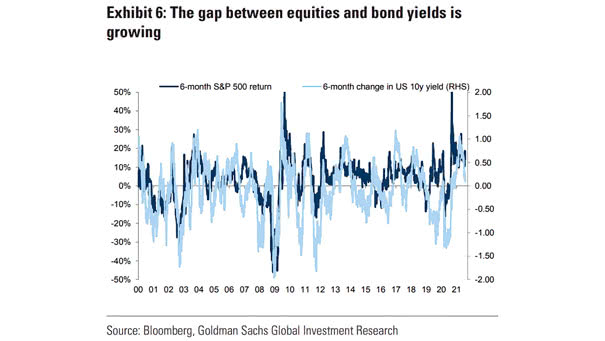
6-Month S&P 500 Return and 6-Month Change in U.S. 10-Year Yield The risk of a correction in U.S. equities is increasing. Image: Goldman Sachs Global Investment Research
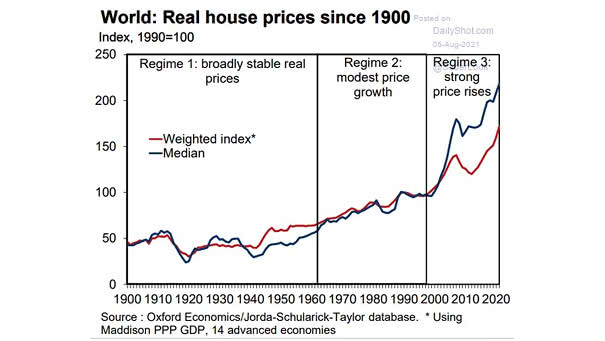
Housing – World Real House Prices Will the latest global housing boom end well? Image: Oxford Economics
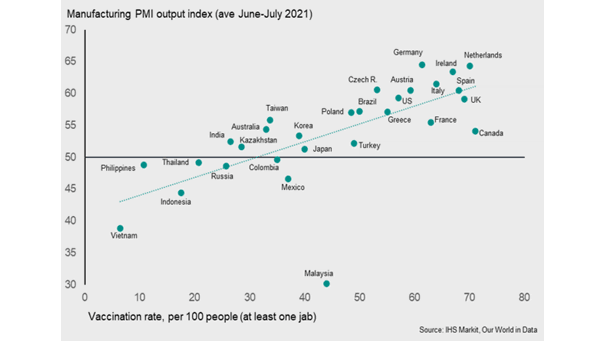
Coronavirus – Manufacturing PMI Output Index and COVID-19 Vaccination Rate COVID-19 vaccination rates tend to drive economic growth. Image: IHS Markit
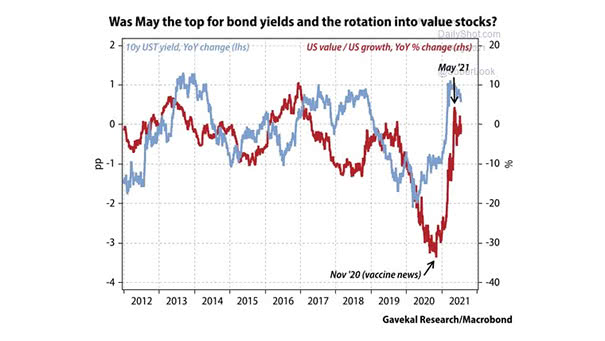
Value Stocks – U.S. 10-Year Treasury Yield and U.S. Value / U.S. Growth Is the value rotation in the U.S. stock market over? Image: Gavekal, Macrobond