Performance – MSCI All Countries ex-USA vs. S&P 500
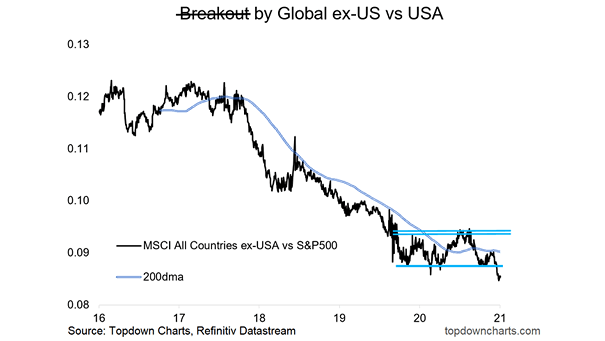
Performance – MSCI All Countries ex-USA vs. S&P 500 Will the S&P 500 continue to outperform global equities ex-U.S.? Image: Topdown Charts
Performance – MSCI All Countries ex-USA vs. S&P 500 Will the S&P 500 continue to outperform global equities ex-U.S.? Image: Topdown Charts
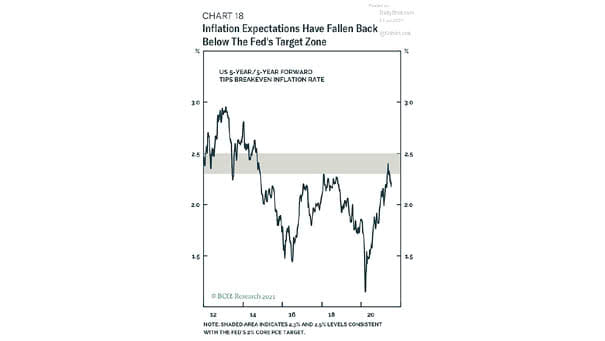
U.S. 5-Year/5-Year Forward TIPS Breakeven Inflation Rate and Fed’s Target Zone Is U.S. inflation still a risk? Image: BCA Research
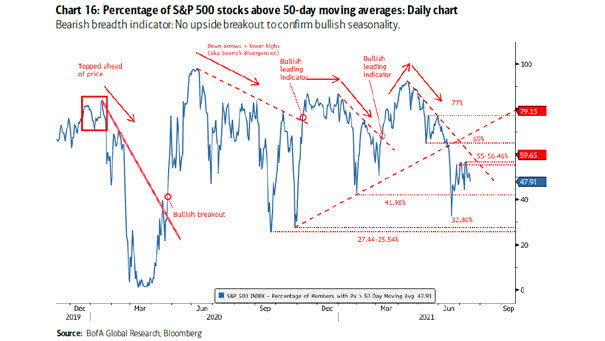
S&P 500 and % of Stocks Above 50-Day Moving Averages Based on the percentage of stocks above 50-day moving averages, market breadth has weakened. Should investors be worried? Image: BofA Global Research
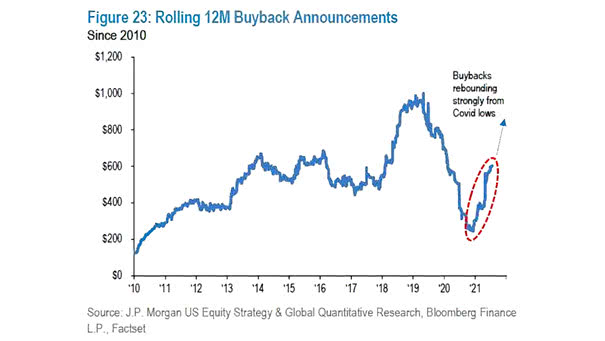
Rolling 12-Month Buyback Announcements Stock buyback announcements continue to increase, which is good news for stocks. Image: J.P. Morgan US Equity Strategy and Global Quantitative Research
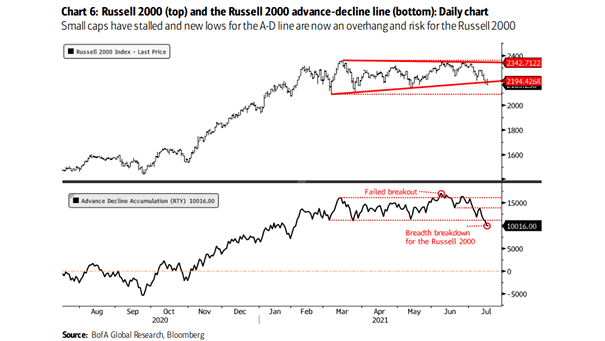
Small Caps – Russell 2000 and Russell Advance-Decline Line New lows for the Russell 2000 advance-decline line tend to favor new lows for the Russell 2000. Image: BofA Global Research
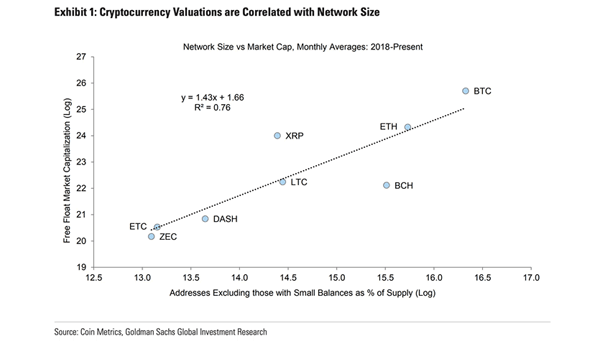
Cryptocurency Valuations and Network Size The size of the network helps explain the valuations of cryptocurrencies. Image: Goldman Sachs Global Investment Research
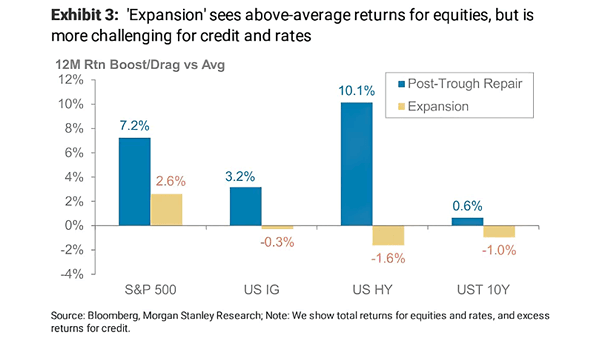
U.S. Markets – 12-Month Return Boost/Drag vs. Average When the U.S. business cycle is in the expansion phase, the S&P 500 tends to have above-average returns over the next 12 months. Image: Morgan Stanley Research
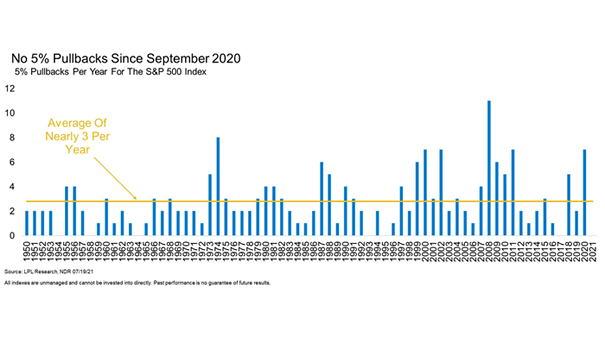
5% Pullbacks per Year for the S&P 500 Index Since 1950, the average number of 5% pullbacks per year in the S&P 500 Index is 3. Will pullbacks be short-lived this year? Image: LPL Research
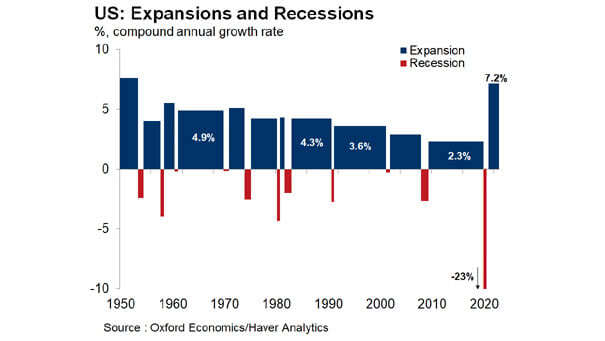
U.S. Expansions and Recessions The coronavirus recession lasted only two months, which is by far the shortest U.S. recession on record. Image: Oxford Economics
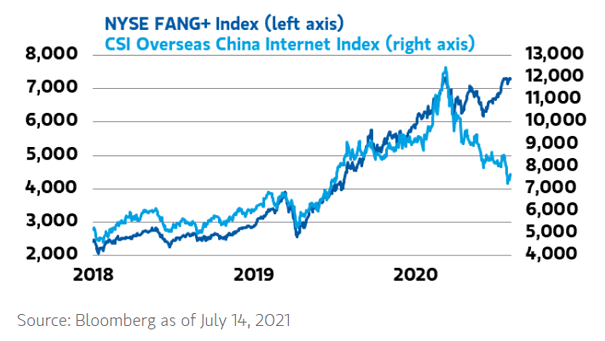
Tech Stocks – NYSE FANG+ Index and CSI Overseas China Internet Index China and U.S. tech stocks are structurally decoupling. Should investors be wary of China’s crackdown on its tech giants? Image: Morgan Stanley Wealth…
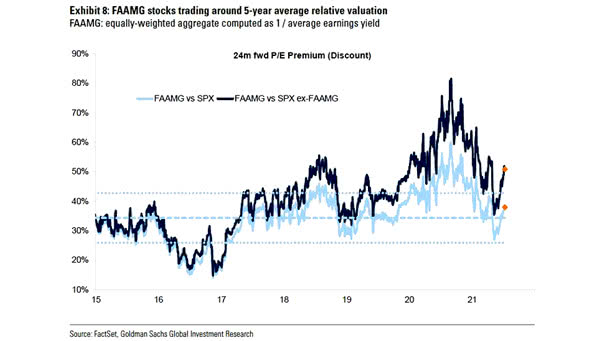
Valuation – FAAMG Stocks vs. S&P 500 The relative valuation of FAAMG stocks remains high. Image: Goldman Sachs Global Investment Research