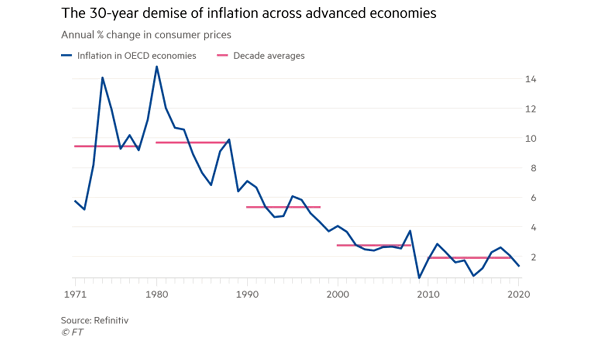
Inflation in OECD Economies and Decade Averages
Inflation in OECD Economies and Decade Averages Should investors worry about inflation coming back? Image: Financial Times
Inflation in OECD Economies and Decade Averages Should investors worry about inflation coming back? Image: Financial Times
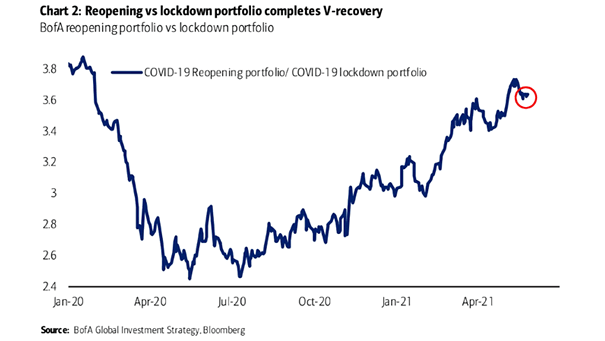
Coronavirus – COVID-19 “Lockdown Portfolio” vs. COVID-19 “Reopening Portfolio” A perfect V-shaped recovery for the reopening portfolio vs. lockdown portfolio. Image: BofA Global Investment Strategy
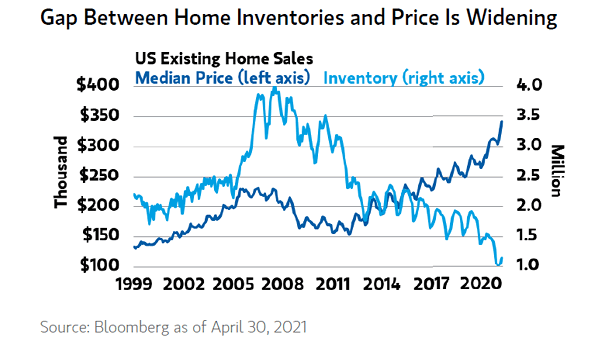
Housing – U.S. Existing Home Sales: Median Price and Inventory The inventory of homes for sale in the U.S. is now very low, with home prices expected to keep climbing. Image: Morgan Stanley Wealth Management
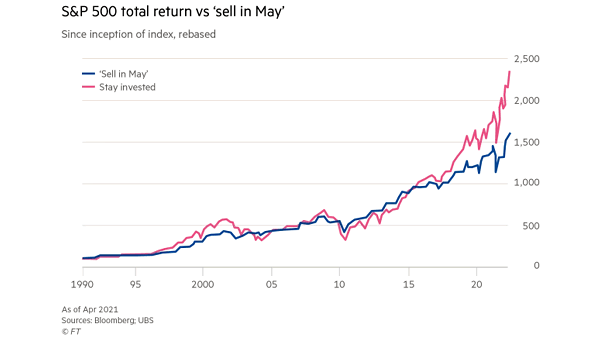
S&P 500 Total Return vs. “Sell in May” Is “Sell in May and Go Away” a myth? Image: Financial Times

China Credit Impulse and U.S. 10-Year Treasury Yield (Leading Indicator) China’s credit impulse tends to lead the U.S. 10-year Treasury yield by one year. Lower Treasury yields ahead? Image: Alpine Macro

Fed MBS Holdings and FHFA House Price Index Despite a strong U.S. housing market, the Federal Reserve continues to buy mortgage-backed securities (MBS). Image: BofA Global Investment Strategy
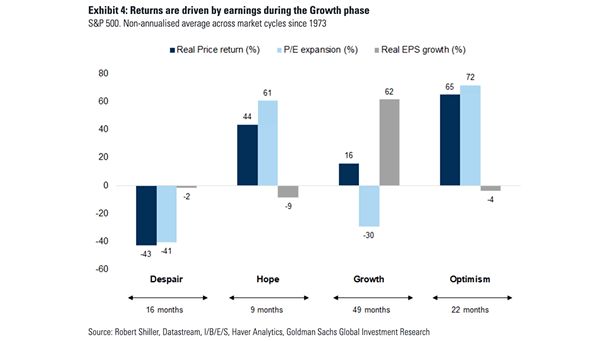
S&P 500 Average Across Market Cycles Since 1973 This chart puts into perspective the typical phases of the U.S. equity market since 1973. Image: Goldman Sachs Global Investment Research
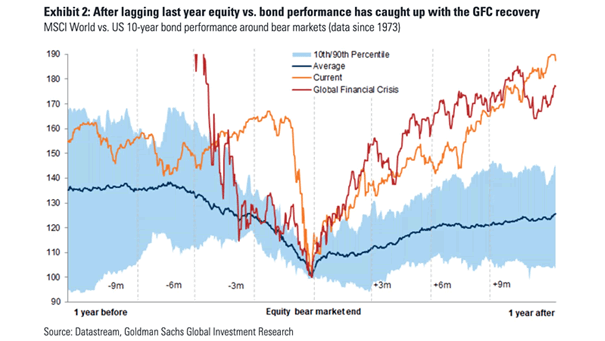
MSCI World vs. U.S. 10-Year Bond Performance Around Bear Markets After the shortest, and one of the sharpest bear markets in history, the equity vs. bond performance is now better than post-GFC. Image: Goldman Sachs…
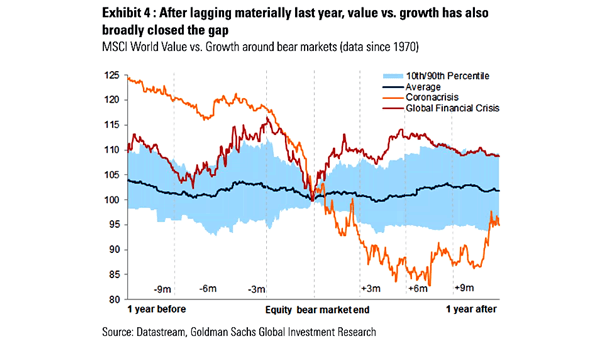
MSCI World Value vs. Growth Around Bear Markets So far, the performance of value vs. growth remains worse than post-GFC. Image: Goldman Sachs Global Investment Research
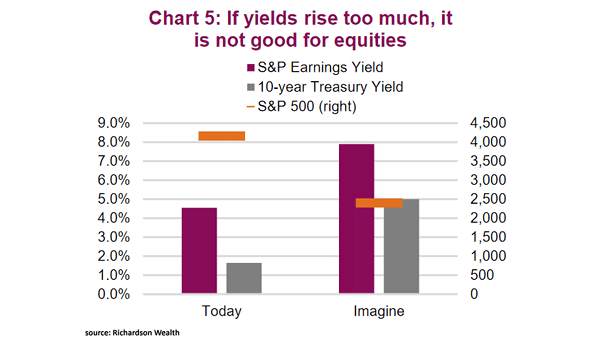
S&P 500 Earnings Yield and U.S. 10-Year Treasury Yield Higher U.S. 10-year Treasury yields would weigh on U.S. equities. Image: Richardson Wealth
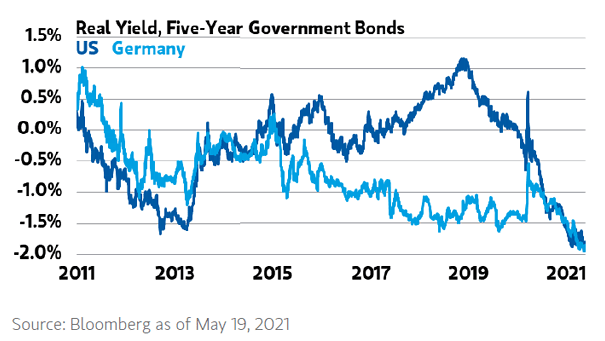
Real Yield – Five-Year Government Bonds, U.S. and Germany Real rate convergence helps explain the weakness of the U.S. dollar. Image: Morgan Stanley Wealth Management