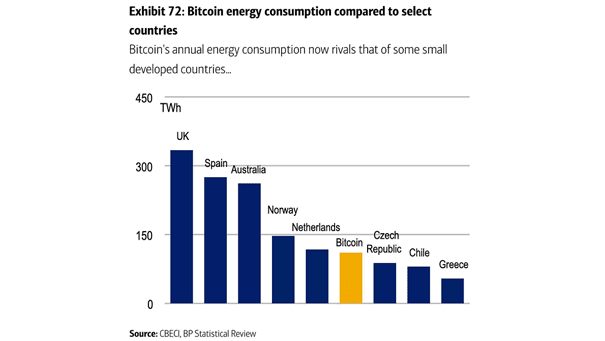
Bitcoin Energy Consumption Compared to Select Countries
Bitcoin Energy Consumption Compared to Select Countries Is Bitcoin really bad for the environment? Image: BofA Global Research
Bitcoin Energy Consumption Compared to Select Countries Is Bitcoin really bad for the environment? Image: BofA Global Research
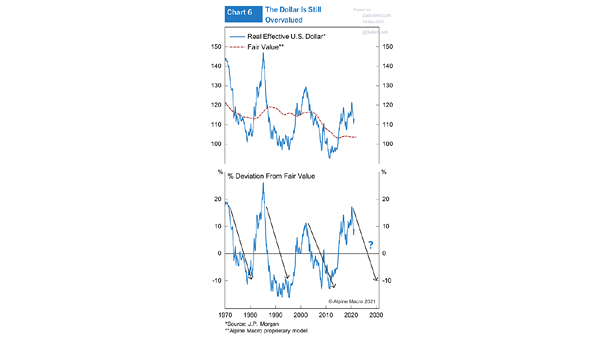
Real Effective U.S. Dollar and Fair Value Is the recent weakness of the U.S. dollar the beginning of a large move? Image: Alpine Macro
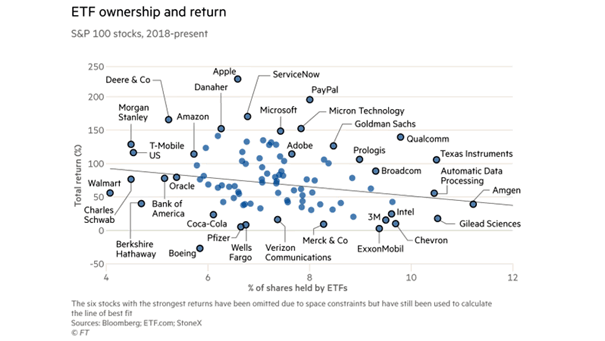
S&P 100 Stocks – ETF Ownership and Return Large-cap U.S. stocks with high ETF ownership tend to underperform since 2018. Image: Financial Times

U.S. Dollar Weighted CPI Differential Historically, when U.S. CPI is higher than rest of the world, the U.S. dollar’s performance tends to be softer. Image: Morgan Stanley Research
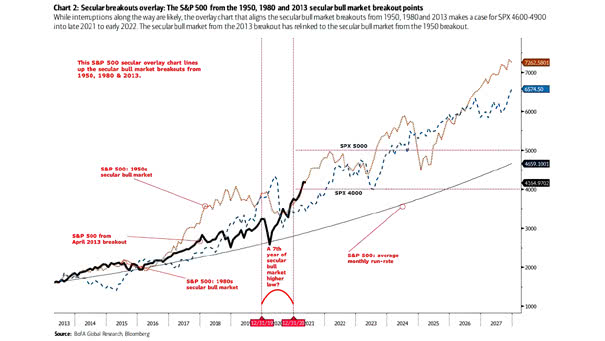
The S&P 500 from the 1950, 1980 and 2013 Secular Bull Market Breakout Points Should investors expect the S&P 500 to hit 4600-4900 into late 2021 to early 2022? Image: BofA Global Research Click the…
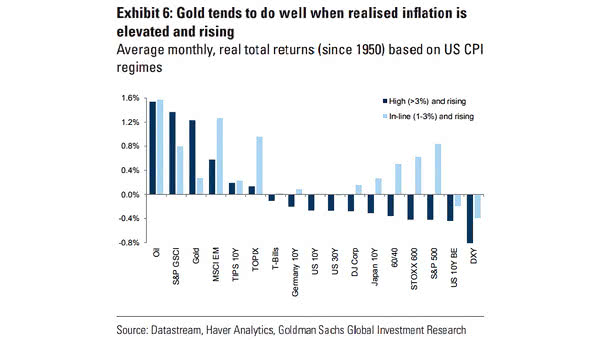
Gold – Real Total Returns Based on U.S. CPI Regimes Historically, gold tends to do well when inflation is above 3% and rising. Image: Goldman Sachs Global Investment Research
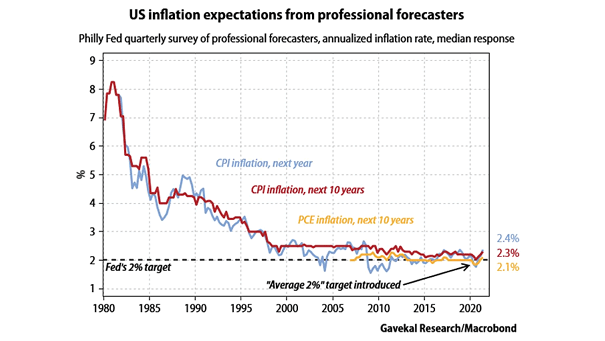
U.S. Inflation Expectations from Professional Forecasters Will the Federal Reserve let inflation run hot for a while? Image: Gavekal, Macrobond
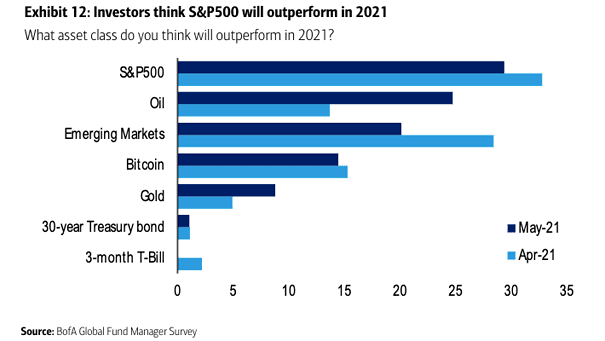
S&P 500 – What Asset Class Will Outperform in 2021? 29% of FMS investors think the S&P500 will outperform this year. Image: BofA Global Fund Manager Survey
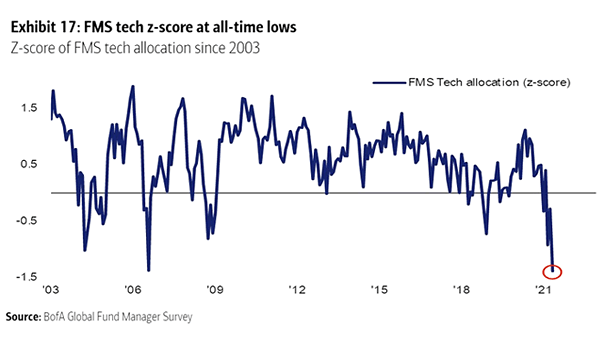
Tech Stocks – FMS Tech Allocation Are FMS investors too cautious on tech stocks? Image: BofA Global Fund Manager Survey
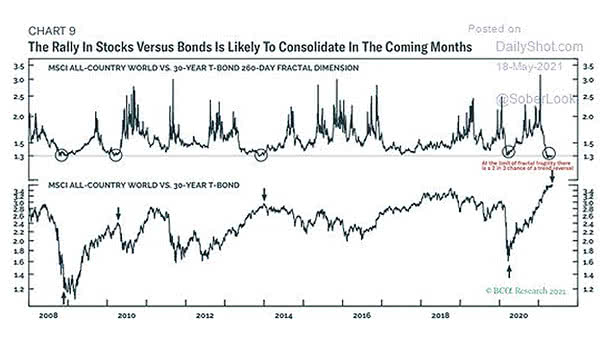
Global Equity Market – MSCI All-Country World vs. 30-Year T-Bond After a strong rally, should investors expect a consolidation in the global equity market in the coming months? Image: BCA Research
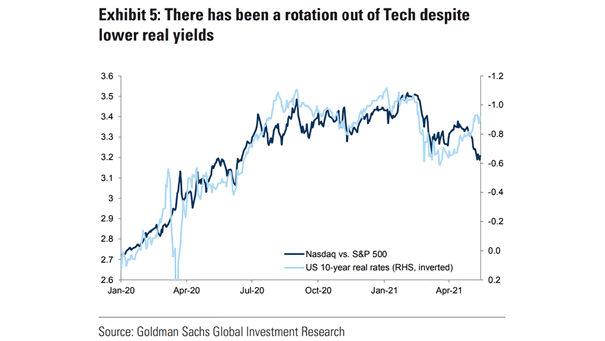
Tech Stocks – Nasdaq vs. S&P 500 and U.S. 10-Year Real Rates The rotation out of tech stocks has continued despite lower real rates. Image: Goldman Sachs Global Investment Research