S&P 500 Index Returns – The Day 100 Indicator
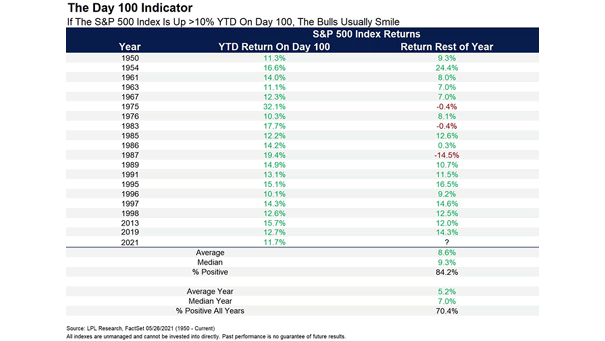
S&P 500 Index Returns – The Day 100 Indicator Historically, if the S&P 500 Index is up more than 10% YTD on day 100, it tends to be bullish through the rest of the year.…
S&P 500 Index Returns – The Day 100 Indicator Historically, if the S&P 500 Index is up more than 10% YTD on day 100, it tends to be bullish through the rest of the year.…
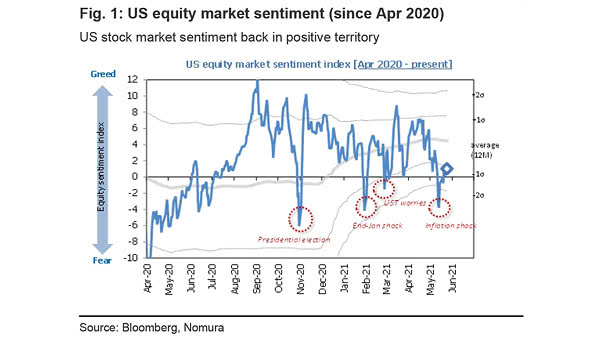
U.S. Equity Sentiment Index U.S. equity market sentiment is improving. Image: Nomura
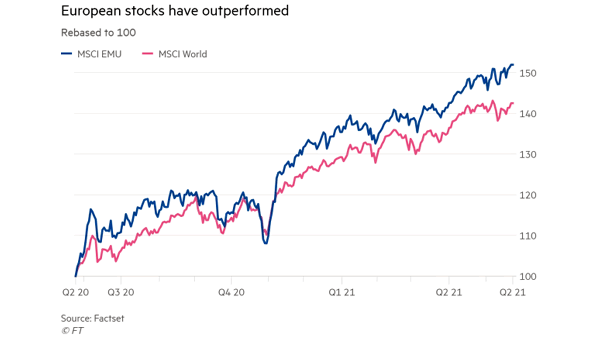
European Stocks and MSCI World Will European stocks continue to outperform global equities? Image: Financial Times
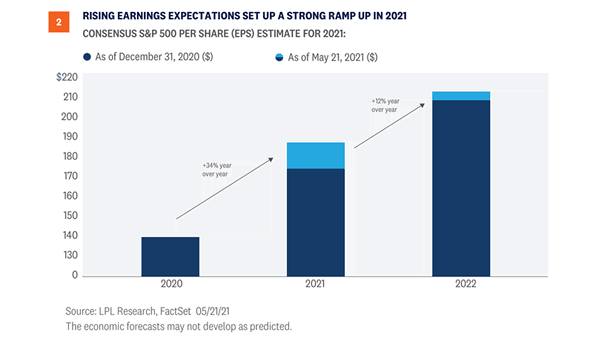
Consensus S&P 500 Per Share (EPS) Estimate for 2021 Earnings estimates have risen a lot since the beginning of the year. Image: LPL Research
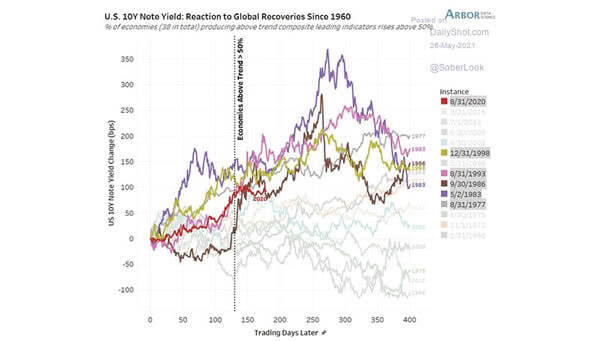
U.S. 10-Year Note Yield: Reaction to Global Recoveries Since 1960 So far, the U.S. 10-year yield continues to follow the path after global recoveries. Image: Arbor Research & Trading LLC
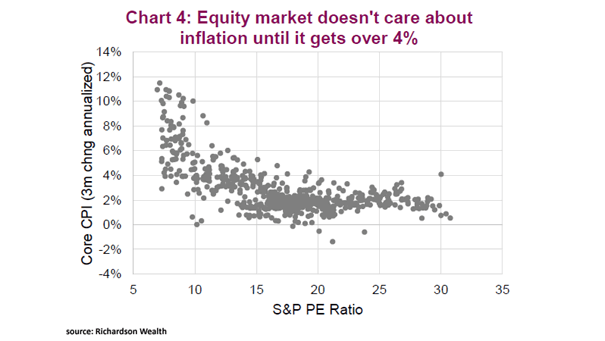
Inflation – S&P 500 P/E Ratio and U.S. Core CPI The U.S. equity market tends to see multiple compression when inflation gets over 4%. Image: Richardson Wealth
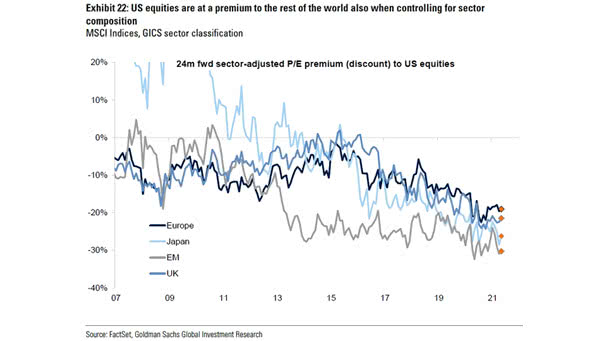
24-Month Fwd Sector-Adjusted P/E Premium (Discount) to U.S. Equities Is the U.S. stock market still the best place to invest? Image: Goldman Sachs Global Investment Research
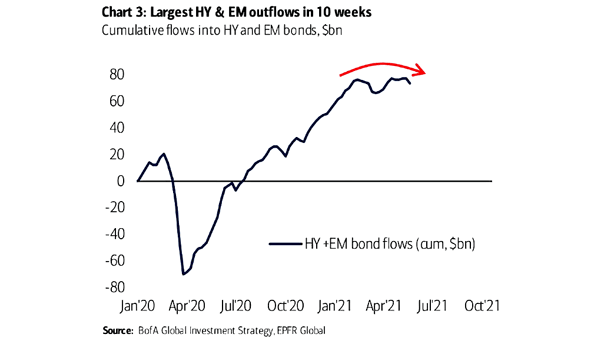
Cumulative Flows into HY and EM Bonds Should investors avoid HY and EM bonds? Image: BofA Global Investment Strategy
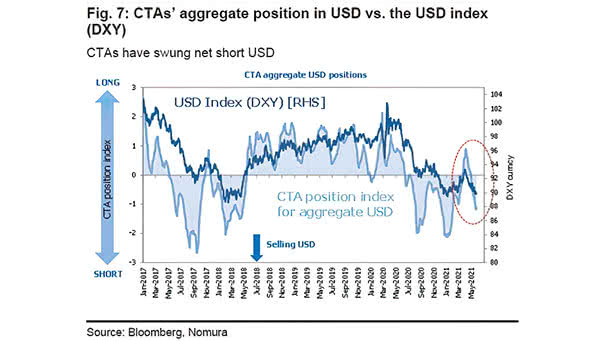
CTAs Aggregate Net Position in USD vs. the Dollar Index (DXY) CTAs remain bearish on the U.S. dollar. Image: Nomura
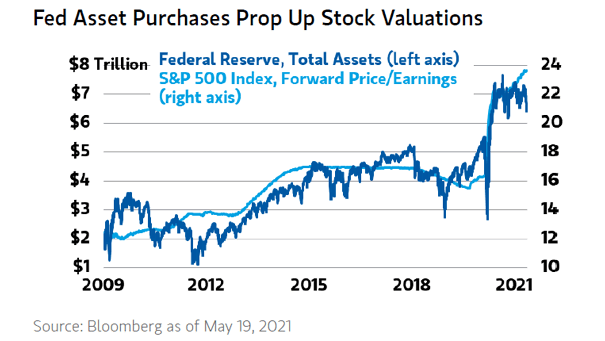
Valuation – Federal Reserve Total Assets and S&P 500 Index Forward Price/Earnings Will Fed asset purchases continue to push valuations higher indefinitely? Image: Morgan Stanley Wealth Management
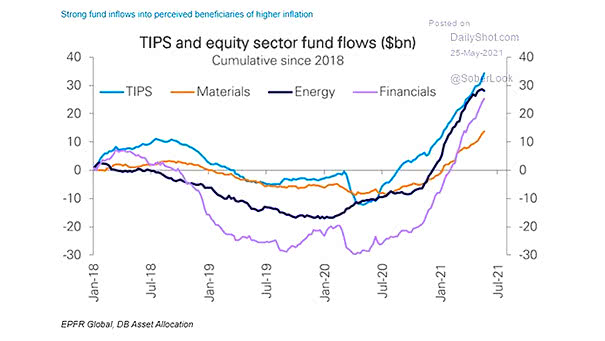
Inflation – TIPS and Equity Sector Fund Flows Strong fund inflows into TIPS, materials, energy and financials. Will the Federal Reserve let the U.S. economy run hot? Image: Deutsche Bank Asset Allocation