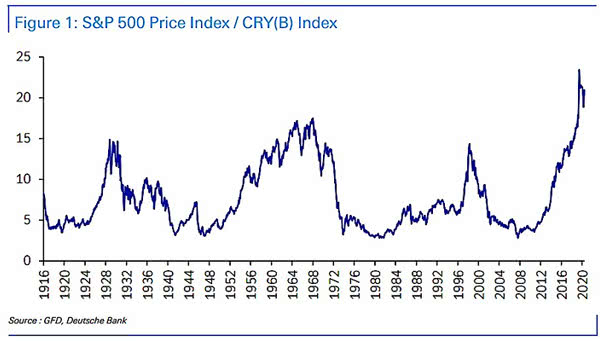
Commodities – S&P 500 Price Index/CRY(B) Index
Commodities – S&P 500 Price Index/CRY(B) Index Are commodities a bargain relative to U.S. equities? Historically, commodities tend to underperform inflation over the long run and stocks tend to outperform. Image: Deutsche Bank