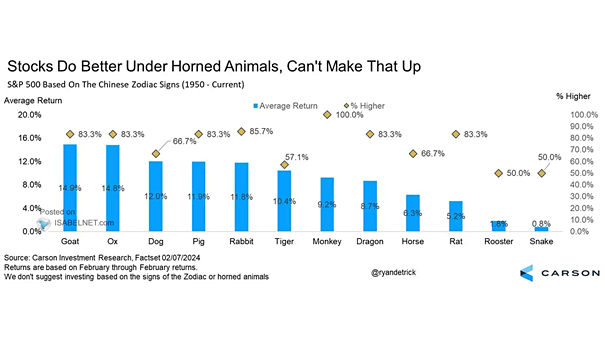
S&P 500 Based on the Chinese Zodiac Signs
S&P 500 Based on the Chinese Zodiac Signs The Year of the Horse has begun. Playful as zodiac signs may be on market trends, the Year of the Horse usually trots rather than gallops, with…
S&P 500 Based on the Chinese Zodiac Signs The Year of the Horse has begun. Playful as zodiac signs may be on market trends, the Year of the Horse usually trots rather than gallops, with…
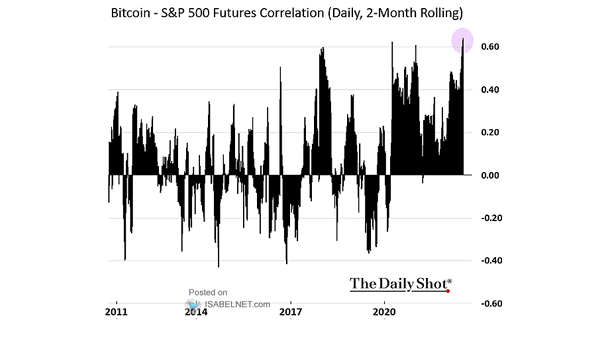
Bitcoin vs. S&P 500 Software Total Return Bitcoin has been trading hand in hand with U.S. software names. Its current drawdown may stick around for a while if the pressure on tech doesn’t ease. But…
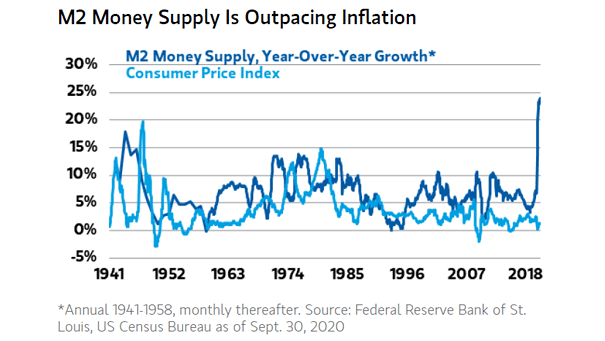
U.S. Inflation – Cleveland Median CPI vs. M2 Savings Deposits When fiscal policy drives money creation, inflation risk jumps. Spending and liquidity rise together, and before long, too much money chases too few goods. Recent…
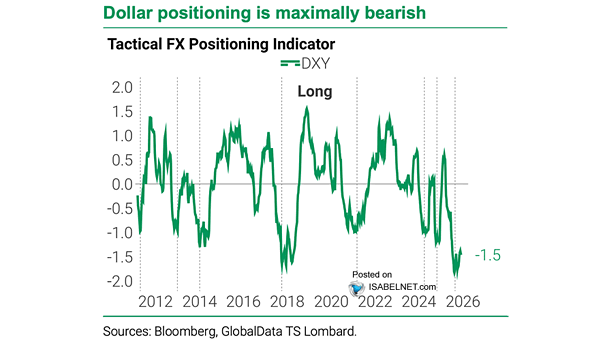
U.S. Dollar Index (DXY) and Purchasing Power Parity Valuation The U.S. dollar remains richly valued on key metrics, leaving it exposed to further downside despite recent softness. Image: TS Lombard
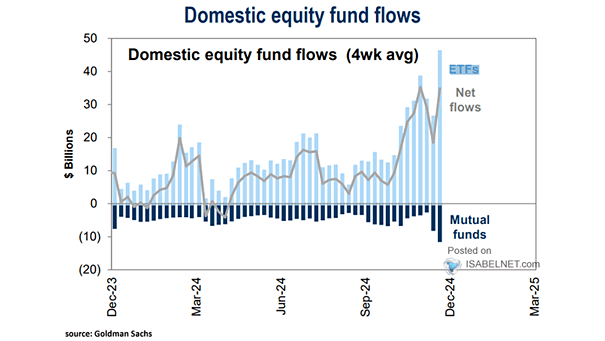
Tax Refunds and U.S. Equity Fund Flows U.S. equity fund inflows tend to pick up sharply during tax refund season. History suggests the next few weeks could see another wave of cash hitting the market.…
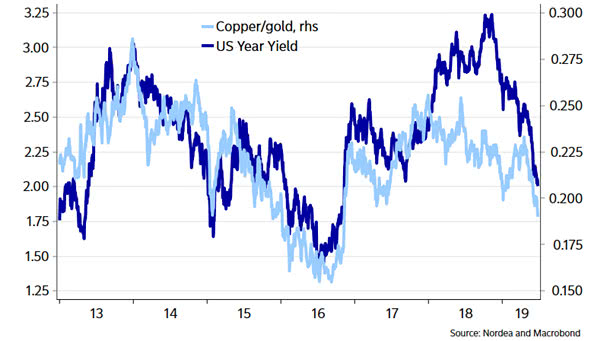
LME Copper Copper surged on shrinking supply and a weaker dollar, with investors wagering that demand from factories, clean energy, and AI will stay strong despite limited mine output. Image: Bloomberg
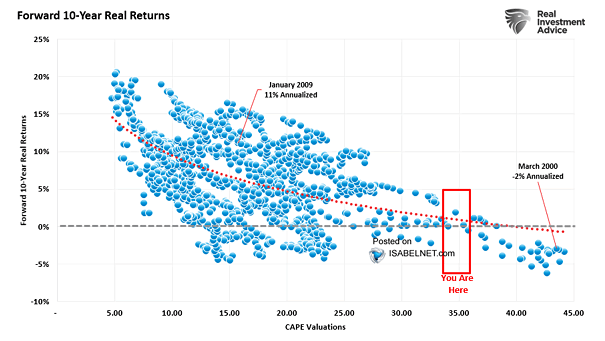
CAPE Valuations and 10 Year Annualized Real Return With the CAPE10 ratio hovering near rarely seen highs, the market is sending a warning signal. Past cycles point to negative real returns ahead. In other words,…
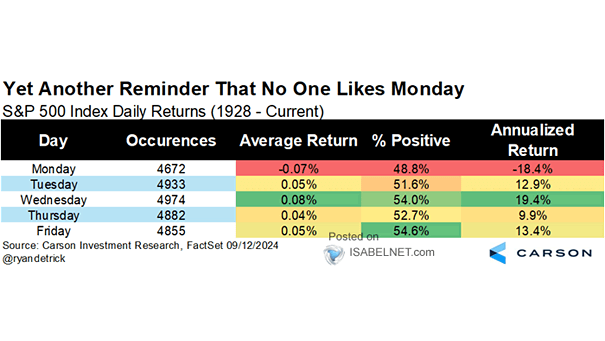
S&P 500 Index Daily Returns For nearly a century, no day has given the S&P 500 more trouble than Monday, the market’s perennial weak spot. Even the markets get the Monday blues! Image: Carson Investment…
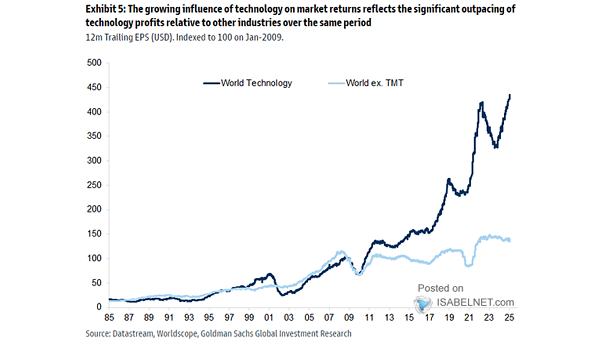
World Technology Earnings Driven by innovation and a digital‑first economy, tech earnings continue to outpace global peers, with momentum still running strong. Digital transformation remains a powerful growth engine. Image: Goldman Sachs Global Investment Research
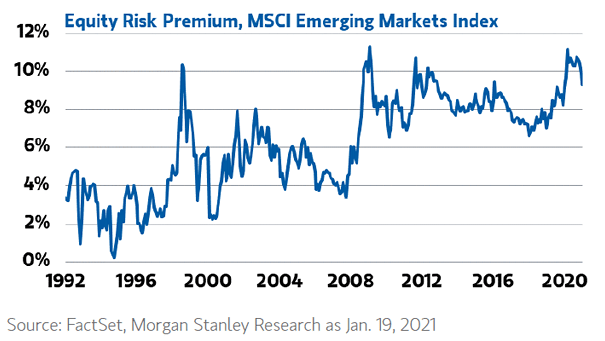
MSCI Emerging Markets Index Emerging markets are back in play, lifted by a softer U.S. dollar, easing global rates, and fresh reforms from Beijing to New Delhi. The rally’s staying power, though, hinges on how…
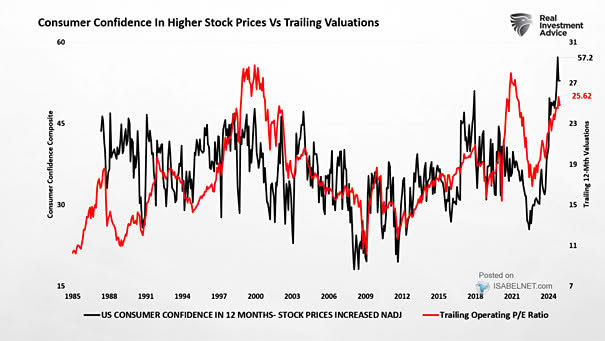
U.S. Consumer Confidence in Higher Stock Prices vs. S&P 500 Trailing Valuations Confidence in future stock gains is fueling higher valuations, with investors paying up for growth they believe will last. But that conviction could…