Cumulative Change in Consensus 2026 EPS Estimates

Cumulative Change in Consensus 2026 EPS Estimates AI infrastructure stocks have seen 2026 earnings estimates jump 55% since December 2024, versus just 7% for the broader S&P 500. Strip them out and earnings fall 1%.…
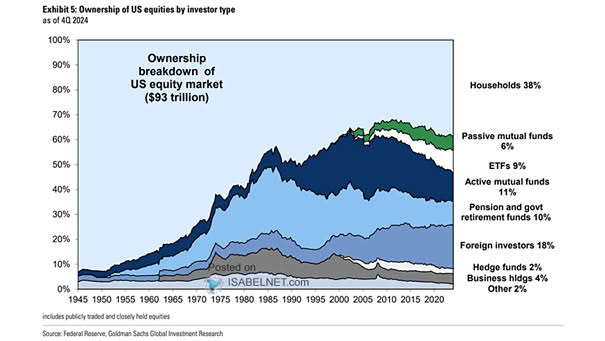
Ownership of the U.S. Equity Market

Ownership of the U.S. Equity Market U.S. households hold 40% of the U.S. equity market. That sounds like broad ownership. In reality, nearly 90% of that stake is held by the wealthiest 10%. Image: Goldman…

Nasdaq 100 Index Contribution in Years of +10-25%

Nasdaq 100 Index Contribution in Years of +10-25% When the Nasdaq‑100 rises +10-25% in a year, the gains are usually driven by just three stocks. That is the nature of cap‑weighted indices. Narrow breadth isn’t…

Hyperscaler Year/Year Cash Spending Growth

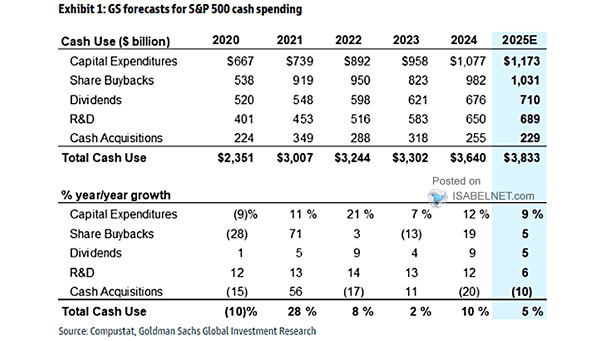
Hyperscaler Year/Year Cash Spending Growth Hyperscalers are ramping up AI spending, leaving less capacity for buybacks and dividends. The trade-off is weaker near-term payouts in exchange for longer-term upside. Image: Goldman Sachs Global Investment Research

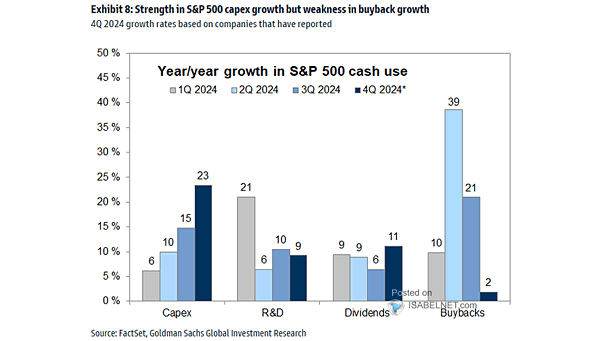
YoY Growth in S&P 500 Cash Use

YoY Growth in S&P 500 Cash Use S&P 500 companies are shifting cash to capex, led by AI, while buybacks stall. The result may be weaker EPS support and a thinner cushion for stock prices.…

10-Year U.S. Treasury Yields vs. New Fed Chair

10-Year U.S. Treasury Yields vs. New Fed Chair 10-year U.S. Treasury yields often push higher in the first six months after a new Fed chair takes office, as markets adjust to a new policy regime.…

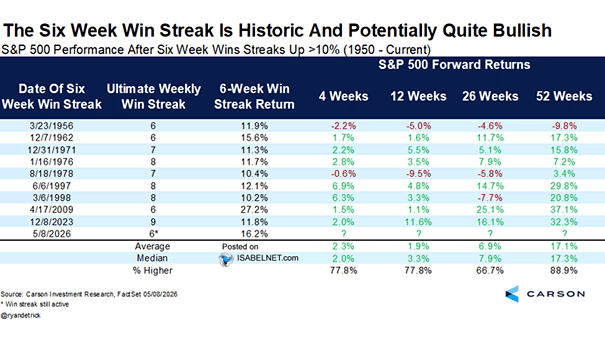
S&P 500 Performance After Six Week Wins Streaks Up >10%

S&P 500 Performance After Six Week Wins Streaks Up >10% Six weeks up and more than 10% higher. Historically, that combination has been a tailwind for U.S. stocks, delivering average 12-month returns of 17.1% since…

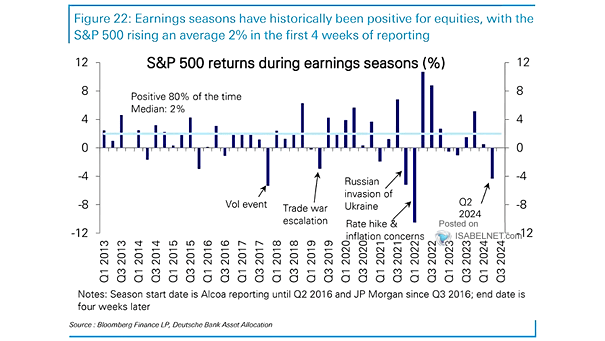
S&P 500 Returns During Earnings Seasons

S&P 500 Returns During Earnings Seasons During earnings season, the S&P 500 typically rallies, posting a median gain of 2% over the first four weeks. This time, the index is up nearly four times that…

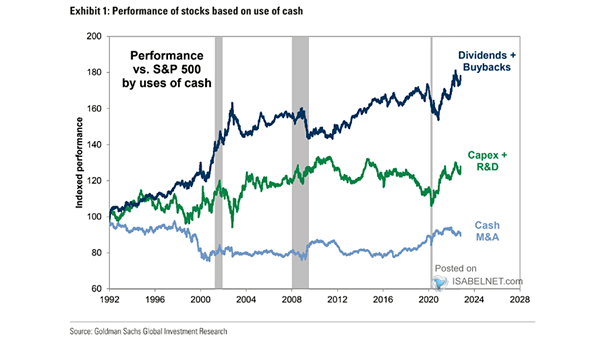
Performance vs. S&P 500 by Uses of Cash

Performance vs. S&P 500 by Uses of Cash U.S. companies that return the most cash to shareholders through dividends and buybacks have outperformed the S&P 500 since 1992. The outperformance usually reflects stronger fundamentals and…