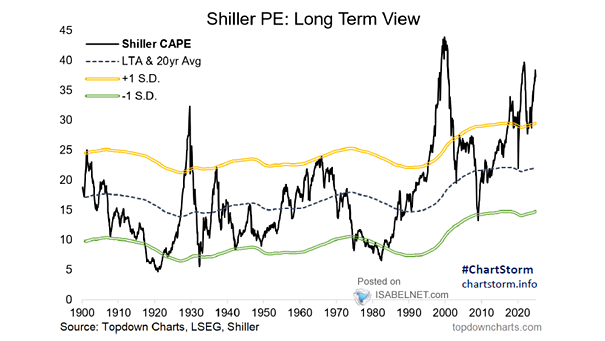
S&P 500 Valuation – Shiller CAPE Ratio
S&P 500 Valuation – Shiller CAPE Ratio Shiller CAPE puts U.S. stocks back in the stratosphere, great on the way up, unforgiving on the way down. From these levels, history argues for lower returns and…
S&P 500 Valuation – Shiller CAPE Ratio Shiller CAPE puts U.S. stocks back in the stratosphere, great on the way up, unforgiving on the way down. From these levels, history argues for lower returns and…
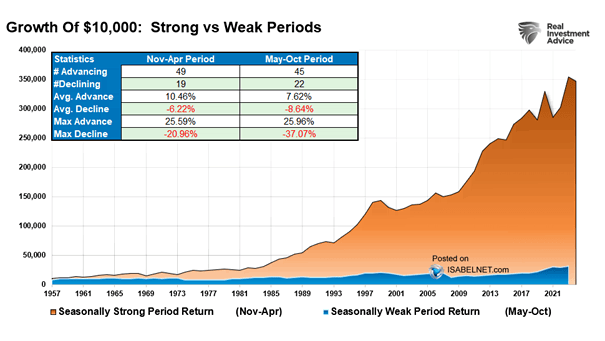
S&P 500 Returns – Strong vs. Weak Periods U.S. stocks tend to lose some of their edge over the summer, with May to October often lagging the stronger November to April period. Even so, seasonality…
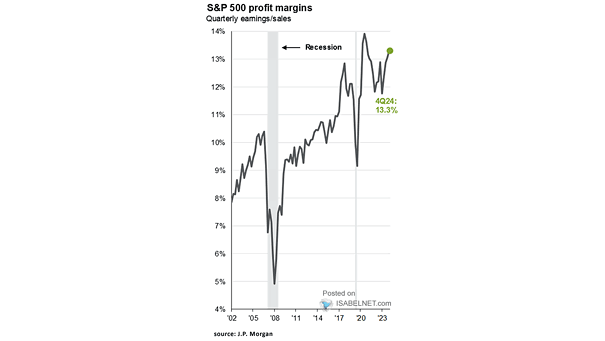
S&P 500 Quarterly Net Profit Margin (ex. Financials & Utilities) Corporate America is delivering solid profits, and with margins set to climb in the coming quarters, the bullish case keeps gaining traction. It’s getting harder…
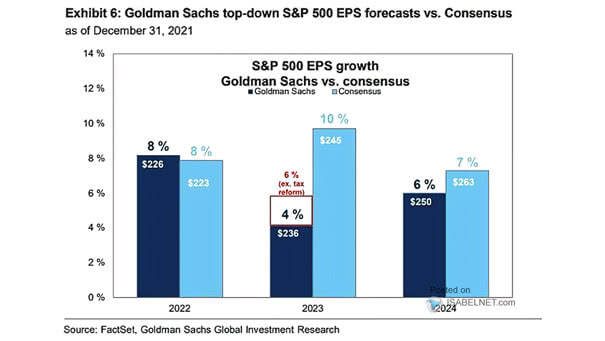
Share of S&P 500 Company Quarter-Ahead EPS Guidance Above Consensus Estimates Strong earnings and confident forecasts are keeping corporate America bullish on near-term profits, adding fuel to already rich valuations. As long as companies deliver,…
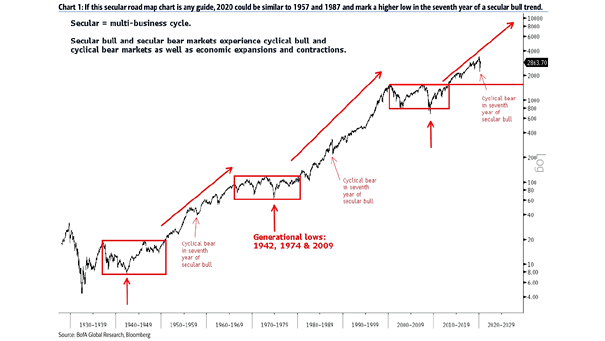
S&P 500 Performance During the 1980-2000 and 2013-Current Secular Bull Markets The S&P 500 has been rising since March 2013, but age alone doesn’t call the top. The last secular bull market ran nearly two…
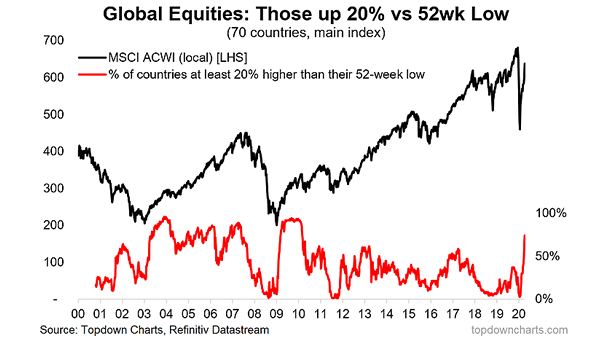
Number of S&P 500 Stocks Making New 52-Week Lows Above 20 The number of S&P 500 stocks hitting new 52-week lows is rising, rarely a healthy signal. In sustained bull markets, new lows tend to…
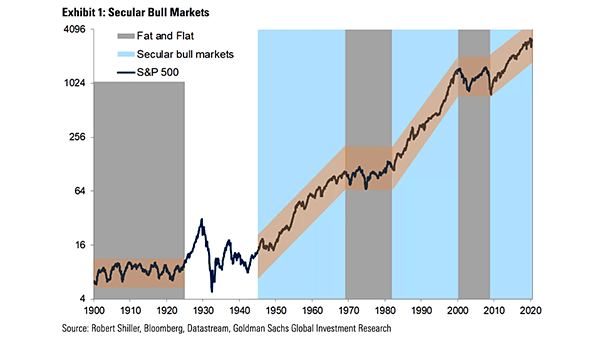
S&P 500 – Bull Markets That Made It To 100% At just 3.5 years old and already up more than 100%, the current bull market still looks like it has legs, leaving bears stuck watching…
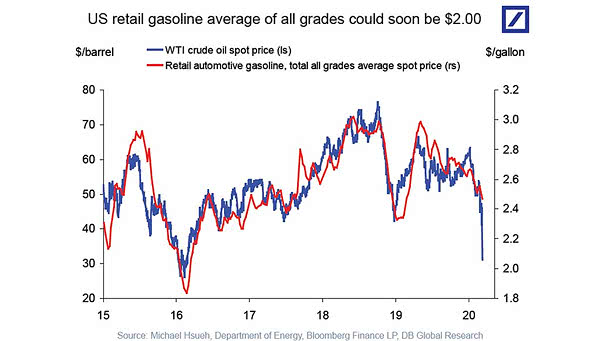
Retail Gasoline Price Change Between February 23 and April 27, 2026 The Middle East conflict is sending fuel costs soaring across Asia, with gasoline prices in Southeast Asia up 37% since the war began. In…
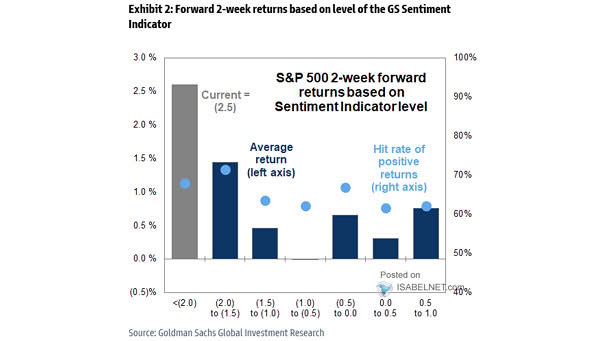
S&P 500 1-Month Forward Returns Based On Sentiment Indicator Level Goldman Sachs’ U.S. Equity Sentiment Indicator sits at 1.7, a reading historically linked to an average 0.4% decline in the S&P 500 over the next…
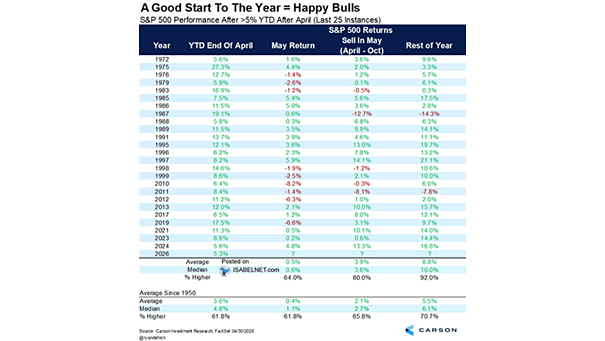
S&P 500 Performance After >5% YTD After April Since 1972, when the S&P 500 has been up more than 5% heading into May, it has ended the year higher 92% of the time, with a…
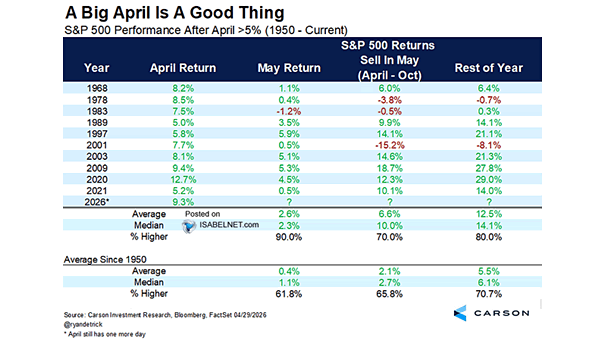
S&P 500 Performance After April >5% Since 1950, a 5%+ April rally has set the tone: May has risen 90% of the time, and the rest of the year has posted a median return of…