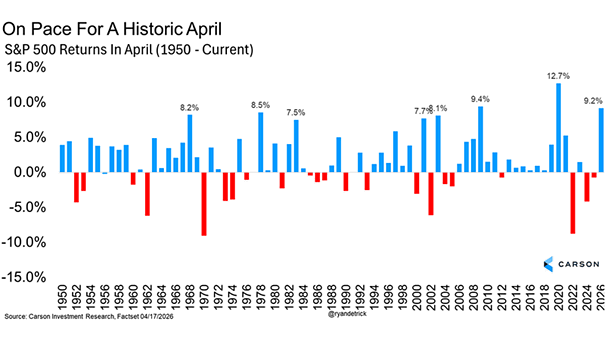
S&P 500 Returns in April
S&P 500 Returns in April With a 10.4% gain, the S&P 500 just posted its second-strongest April since 1950, a powerful boost that often spills into the rest of the year, especially alongside new highs.…
S&P 500 Returns in April With a 10.4% gain, the S&P 500 just posted its second-strongest April since 1950, a powerful boost that often spills into the rest of the year, especially alongside new highs.…
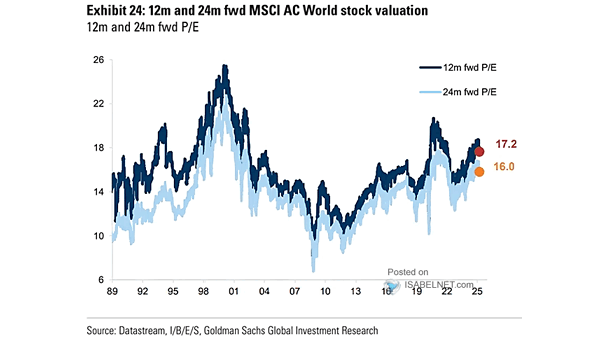
Valuation – MSCI World 12-Month Forward PE With global equities trading at 18.5 times forward earnings, valuations look stretched by historical standards. Not a bubble, but far from cheap. Image: Goldman Sachs Global Investment Research
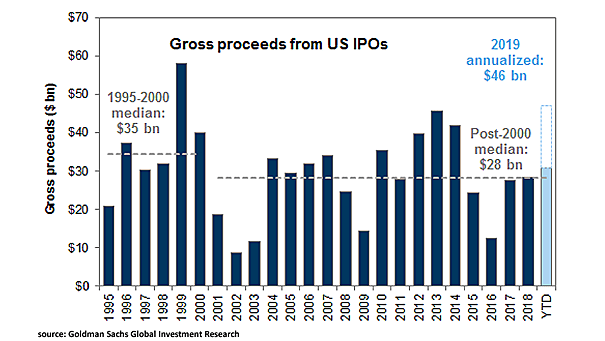
Annual Average IPO Return During First Trading Day In 2026, U.S. IPOs rose 19% on average in their first trading session, edging above the 30-year median and delivering a solid first-day pop. Image: Goldman Sachs…
% of Companies with Revenue Exposure to Just One Sector (TOPIX 500, MXAPJ, STOXX 600, S&P 500) The S&P 500 shows a striking level of concentration, with 61.1% of its companies relying on a single…
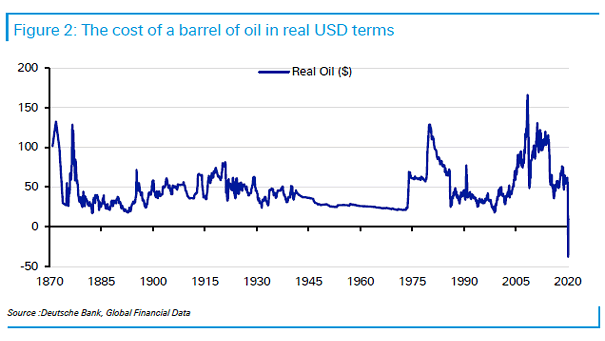
WTI Oil Prices in Real Terms The 2026 oil shock looks far less dramatic in historical terms. It still bites, just not with the same force. Once you adjust for inflation and reduced energy intensity,…
Central Bank Gold Purchases Central bank gold buying eased to 863 tonnes in 2025 from 1,092 tonnes in 2024. Buying has cooled, but official-sector demand remains well above historical standards and continues to play a…
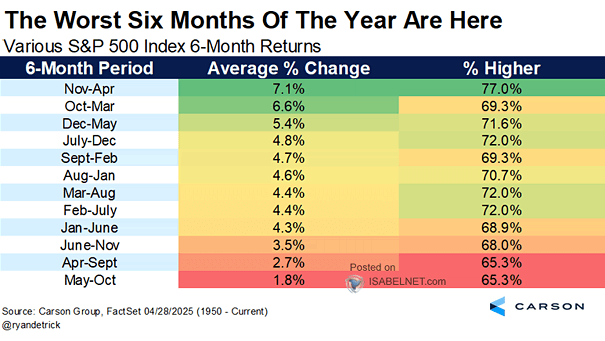
Various S&P 500 Index 6-Month Returns May-October is often seen as the weaker stretch for U.S. stocks, averaging just 2.1%. But when April rallies more than 5%, history flips the script: since 1950, the S&P…
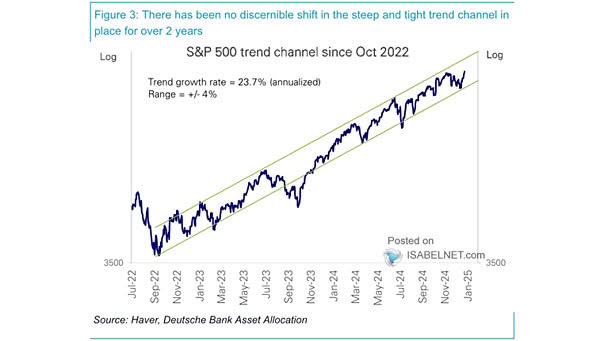
Returns – S&P 500 Price Index and Implied Trend Growth Rate The S&P 500 sits squarely in the middle of its post-GFC trend channel, hardly stretched, but far from a bargain. Image: Deutsche Bank
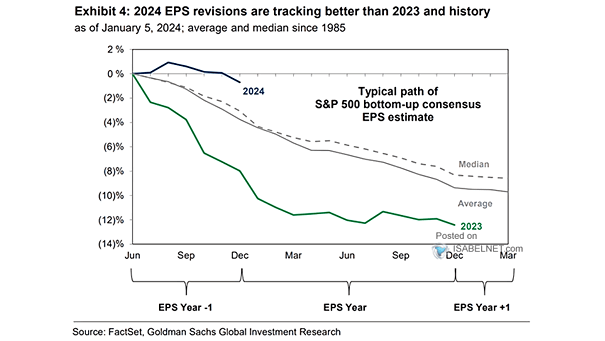
Typical Path of S&P 500 Bottom-Up Consensus EPS Estimate Analysts usually trim EPS estimates in the first four months of the year. Not this time. In 2026, revisions are heading higher, fueled by AI optimism…
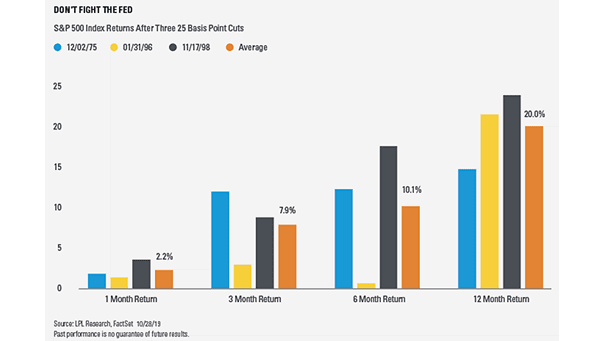
S&P 500 Index Returns Past 10 Years (May – October) May-October is often seen as the weaker stretch for the S&P 500, but the track record tells a different story. Over the past decade, the…
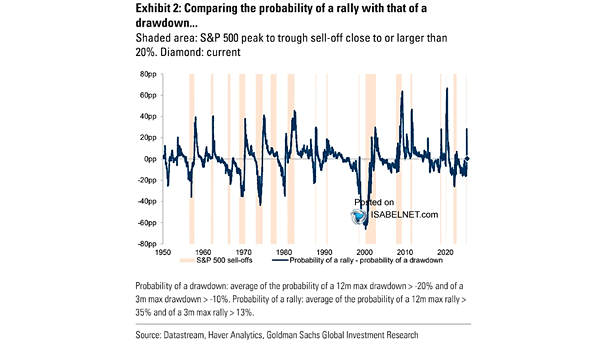
Probability of S&P 500 Drawdown / Rally The rally has made U.S. equities a tougher trade. Upside now looks constrained, while the risk of a pullback is growing amid stretched valuations and a weakening macro…