Equity Performance and Real Trade Weighted US Dollar Index
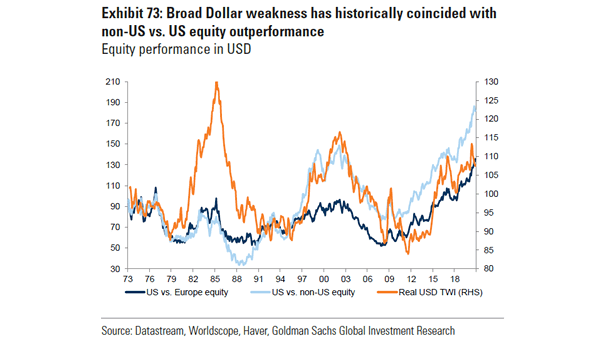
Equity Performance and Real Trade Weighted US Dollar Index Non-U.S. equity markets tend to outperform when the U.S. dollar is weak. Image: Goldman Sachs Global Investment Research
Equity Performance and Real Trade Weighted US Dollar Index Non-U.S. equity markets tend to outperform when the U.S. dollar is weak. Image: Goldman Sachs Global Investment Research
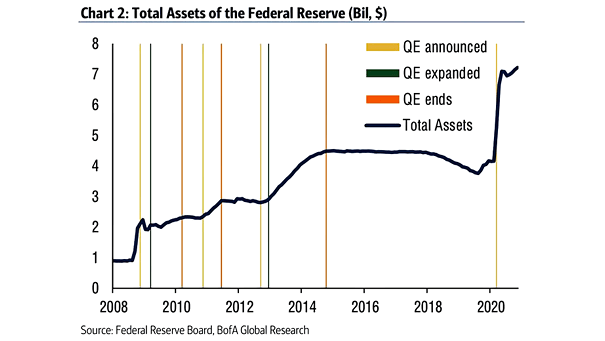
Quantitative Easing (QE) – Total Assets of the Federal Reserve Are investors facing a reality of QE to infinity and beyond? Image: BofA Global Research
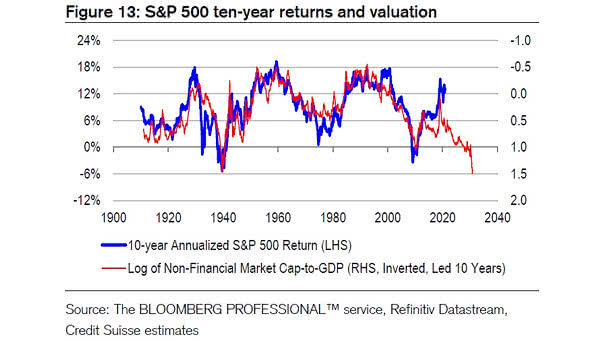
S&P 500 Ten-Year Returns and Valuation Should investors expect anemic S&P 500 returns over the next 10 years? Image: Credit Suisse
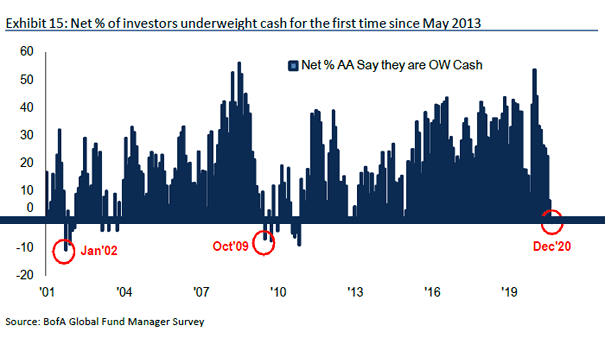
Cash – FMS Investors BofA FMS investors are underweight cash, suggesting an early-stage recovery as after the internet bubble and the Great Financial Crisis. Image: BofA Global Fund Manager Survey
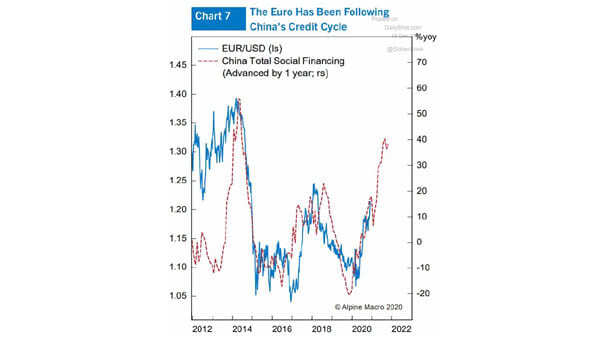
Euro to U.S. Dollar (EUR/USD) and China’s Credit Cycle (Leading Indicator) China’s credit cycle tends to lead the EUR/USD by one year. Image: Alpine Macro
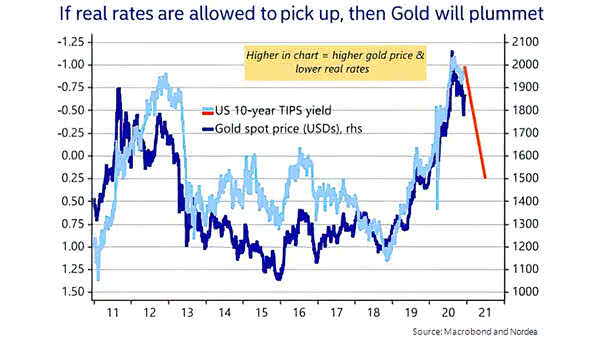
Gold Spot Price and U.S. 10-Year TIPS Yield Generally, when the U.S. 10-year TIPS yield goes up, gold tends to go down. Image: Nordea and Macrobond
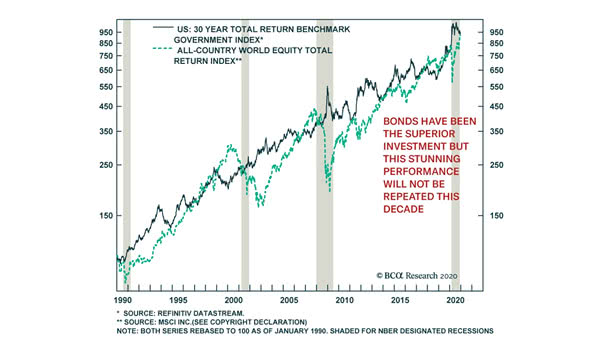
U.S. 30 Year Total Return Benckmark Government Index and All-Country World Total Return Index Could rising inflation be more painful for bonds than for equities? Image: BCA Research
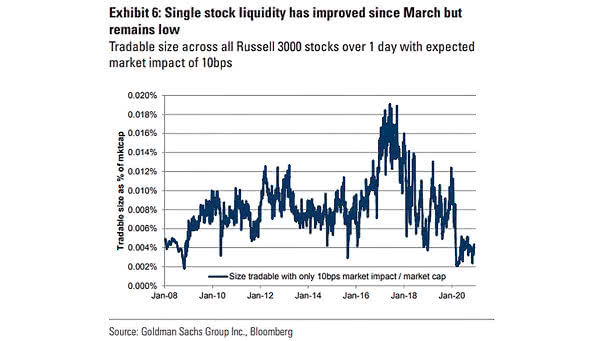
Single Stock Liquidity Single stock liquidity is improving since March, but remains below average levels. Image: Goldman Sachs
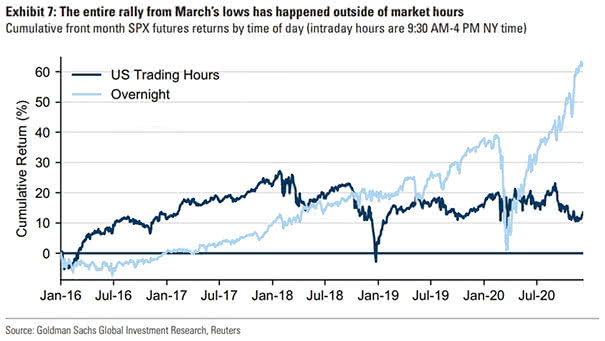
Cumulative Front Month S&P 500 Futures Returns by Time of Day Gains in S&P 500 futures have occurred after-hours since March lows. Image: Goldman Sachs Global Investment Research
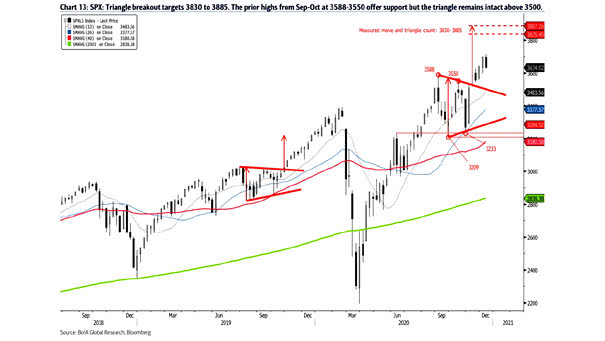
S&P 500 and Bullish Triangle Pattern The bullish triangle pattern could suggest 3800s into early 2021 for the S&P 500. Image: BofA Global Research
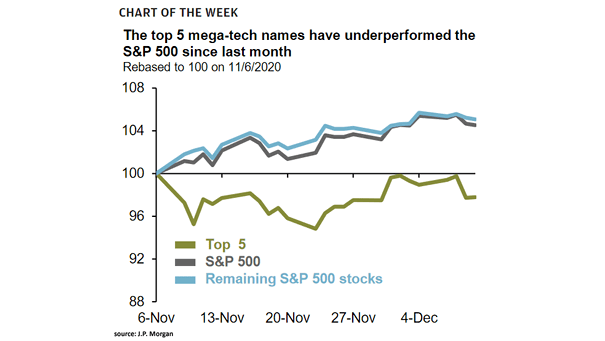
Performance – Top 5 Stocks vs. S&P 500 and Remaining S&P 500 Stocks Will the top 5 mega-tech stocks continue to underperform the S&P 500? Image: J.P. Morgan Asset Management