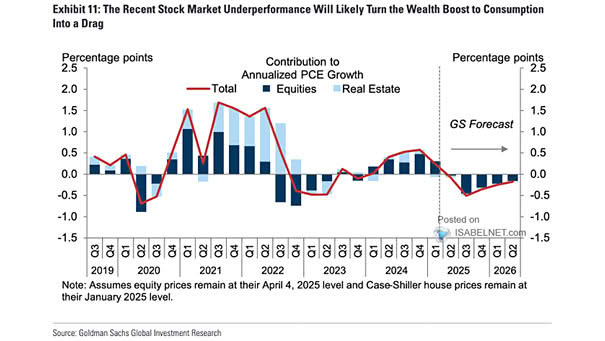
S&P 500 Year-End Target

S&P 500 Year-End Target Oppenheimer projects strong gains for the S&P 500 supported by macroeconomic fundamentals, progress in trade deals, and structural technological shifts, with a year-end 2025 target of 7,100 points implying continued robust…

Tariffs Impact on YoY U.S. GDP Growth

Tariffs Impact on YoY U.S. GDP Growth Over the next three years, higher tariffs are expected to slow U.S. GDP growth by 1.7%, as they raise costs for consumers and businesses, fuel inflation, and drag…

Performance of the Most Shorted Stocks vs the Russell 3000

Performance of the Most Shorted Stocks vs the Russell 3000 The recent three-month period has been exceptionally strong for the most heavily shorted stocks outside the pandemic boom, driven significantly by retail investors and short…

Speculative Trading Indicator 3-Month Changes

Speculative Trading Indicator 3-Month Changes While the U.S. stock market may continue rallying in the near term due to strong earnings and positive trade developments, the heightened speculative activity raises the risk of a notable…

Performance of the Most Shorted Stocks Relative to Russell 3000

Performance of the Most Shorted Stocks Relative to Russell 3000 Over the last 3 1/2 months, the most heavily shorted stocks have experienced extraordinary rallies, significantly outperforming the broader market. Image: Deutsche Bank Asset Allocation

U.S. Credit Card Debt

U.S. Credit Card Debt Rising credit card debt shows weakened repayment discipline and financial strain from inflation in basic living costs, creating a feedback loop where increased debt and fees further hinder consumers’ ability to…

S&P 500 – 13-Week and 26-Week Moving Average

S&P 500 – 13-Week and 26-Week Moving Average The S&P 500 shows a positive medium-term trend, indicated by moving average crossover signals. Specifically, the 13-week moving average remains above the 26-week moving average and continues…