S&P 500 November Seasonality
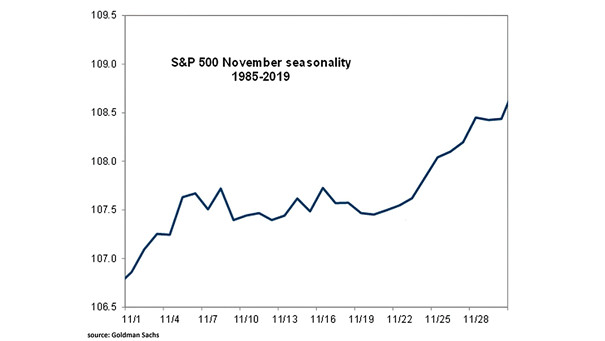
S&P 500 November Seasonality Can investors expect a Thanksgiving rally this year? Image: Goldman Sachs Global Investment Research
S&P 500 November Seasonality Can investors expect a Thanksgiving rally this year? Image: Goldman Sachs Global Investment Research
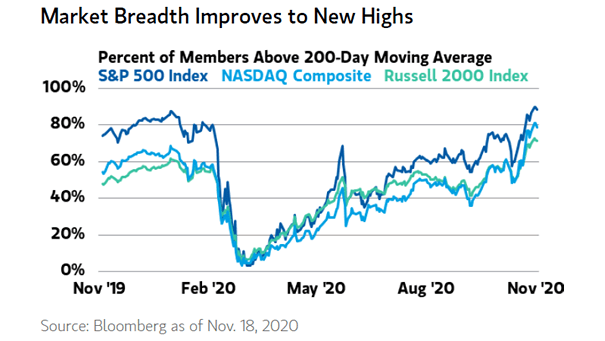
Market Breadth – Percent of Members Above 200-Day Moving Average Market breadth has improved dramatically. 85% of S&P 500 stocks above the 200-day moving average is historically bullish. Image: Morgan Stanley Weath Management
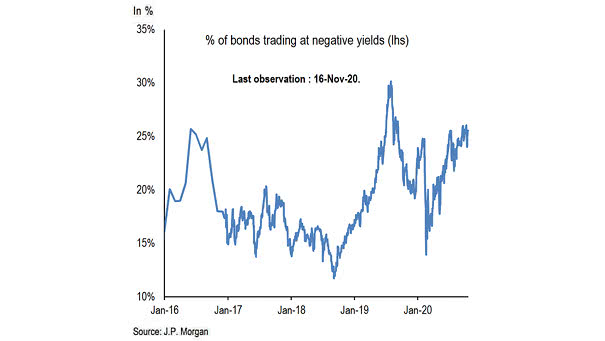
% of Bonds Trading at Negative Yields Bonds that are trading at negative yields jump again. Image: J.P. Morgan

Performance – All Weather Portfolio (Stocks, Bonds, Cash and Gold) The All Weather Portfolio of 25/25/25/25 in stocks, bonds, cash and gold is up 14% YTD, well above its historical annual average of 6%. Image:…
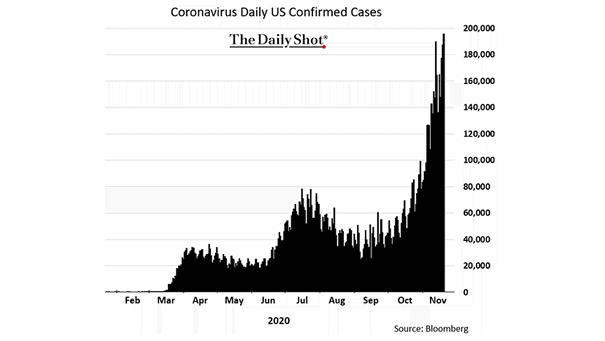
Coronavirus – Daily Number of New COVID-19 Cases in the United States COVID-19 cases in the United States keep climbing, signaling an expanding outbreak. Image: The Daily Shot
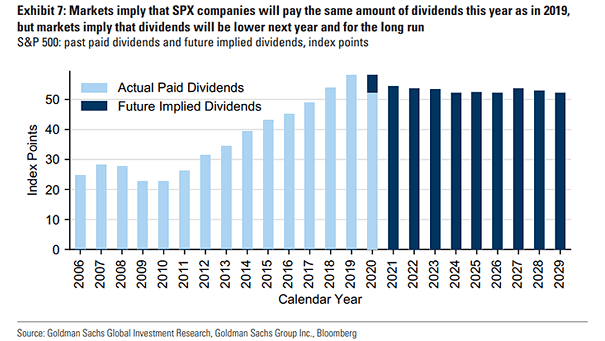
S&P 500 – Actual Paid Dividends and Future Implied Dividends Markets are pricing lower dividends for S&P 500 companies over the long term. Image: Goldman Sachs Global Investment Research
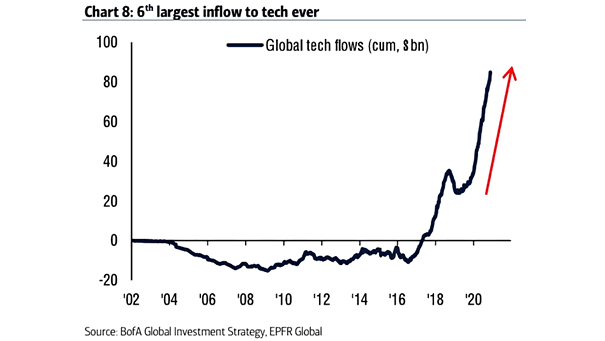
Global Tech Flows 6th largest inflow to tech ever, as investors expect the tech sector to continue to outperform Image: BofA Global Investment Strategy
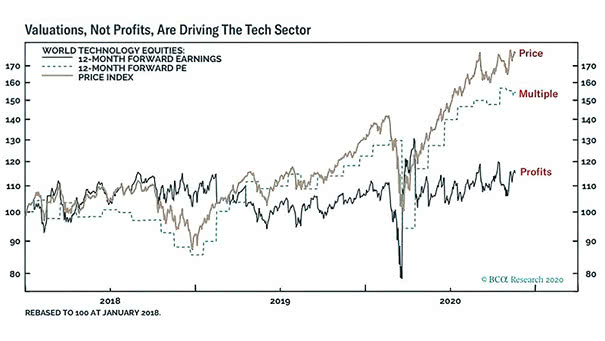
Valuation – World Technology Equities Rising bond yields could hurt the tech sector, as it is very sensitive to higher yields. Image: BCA Research
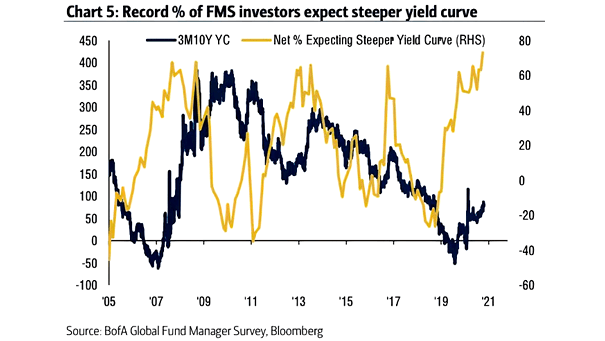
FMS Investors and 10Y-3M Yield Curve FMS investors are expecting a steeper yield curve. At 73%, this is an all-time high. Image: BofA Global Fund Manager Survey
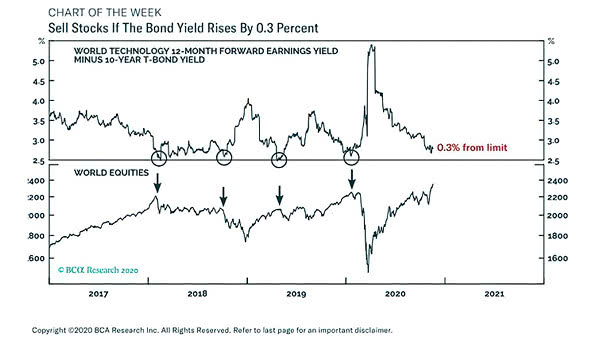
World Equities and U.S. 10-Year Treasury Bond Yield Chart suggesting to sell stocks if the earnings yield spread reaches 2.5%. Image: BCA Research
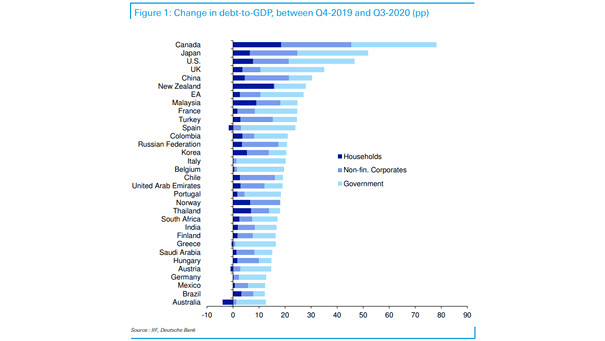
Change in Debt-to-GDP Between Q4-2019 and Q3-2020 Countries are accumulating record amounts of debt. This chart puts into perspective the rise in debt-to-GDP ratio by country between Q4-2019 and Q3-2020. Image: Deutsche Bank