
10-Year U.S. Treasury Yields: 2016 vs. 2020
10-Year U.S. Treasury Yields: 2016 vs. 2020 Are higher Treasury yields coming? This chart suggests that 2020 looks very similar to 2016. Image: Morgan Stanley Research
10-Year U.S. Treasury Yields: 2016 vs. 2020 Are higher Treasury yields coming? This chart suggests that 2020 looks very similar to 2016. Image: Morgan Stanley Research
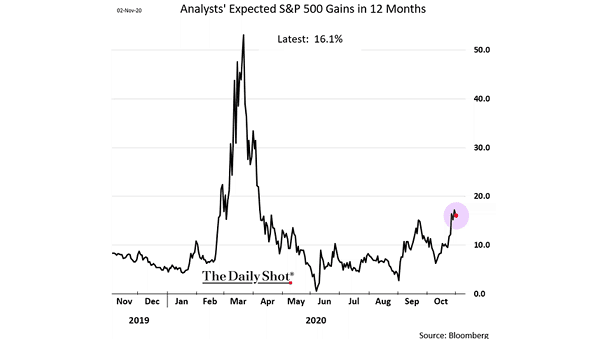
Analysts’ Expected S&P 500 Gains in 12 Months Analysts are optimistic and expect the S&P 500 to be up 16.1% in 12 months. Image: The Daily Shot
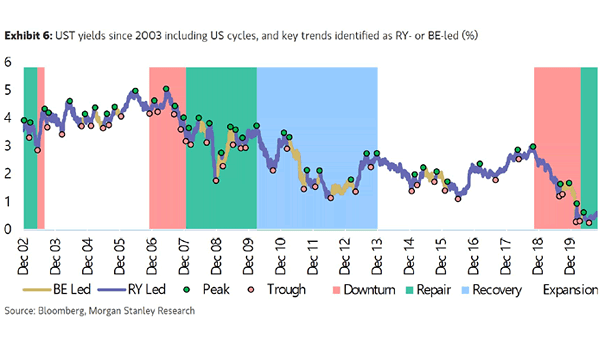
U.S. Treasury Yields Since 2003 Including U.S. Cycles and Key Trends Chart suggesting that the current move in U.S. Treasuries coincide with the recovery phase of the U.S. economic cycle. Image: Morgan Stanley Research
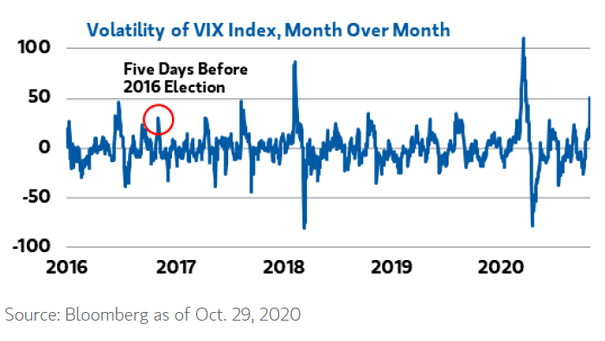
Volatility of VIX Index The VIX volatility could suggest a shift in the business cycle or a structural shift. Image: Morgan Stanley Wealth Management
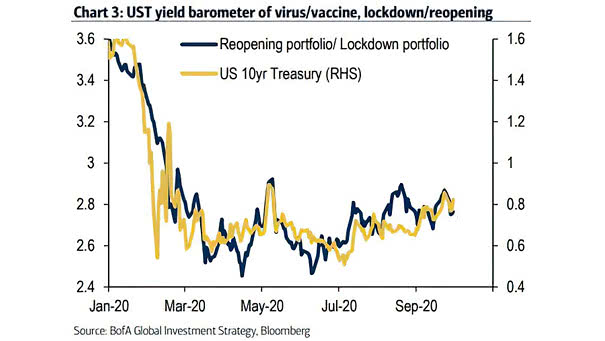
U.S. 10-Year Treasury Yield Barometer of Coronavirus/Vaccine vs. Reopening Portfolio / Lockdown Portfolio Are higher Treasury yields coming on the approval of a coronavirus vaccine? Image: BofA Global Investment Stratey
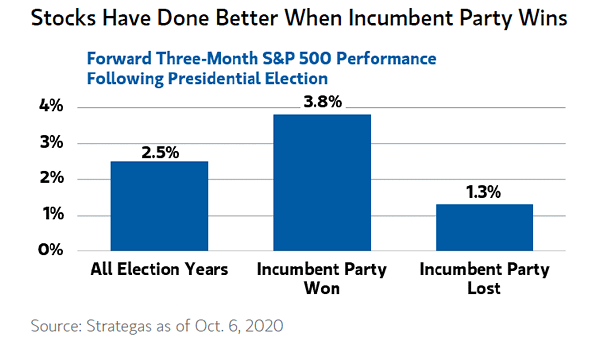
Forward Three-Month S&P 500 Performance Following U.S. Presidential Election The S&P 500 tends to do much better if the President is re-elected. Image: Morgan Stanley Wealth Management
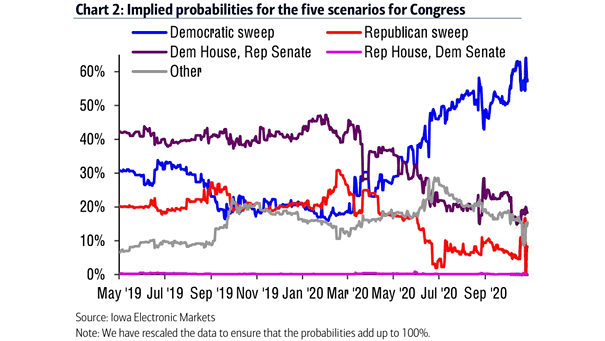
U.S. Elections – Implied Probabilities for the Five Scenarios for Congress The odds of a Democratic sweep remain relatively high. Image: BofA
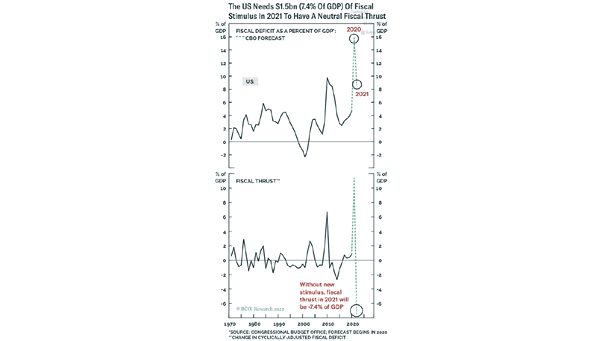
U.S. Fiscal Deficit as a Percent of GDP and Fiscal Thrust Is too much stimulus better than too little? Image: BCA Research

AA Returns Next 4 Years under S&P 500 and 10-Year U.S. Treasury Assumptions Investors should expect much lower returns over the next 4 years, unless the S&P 500 can rally to 5,800. Image: BofA Global…
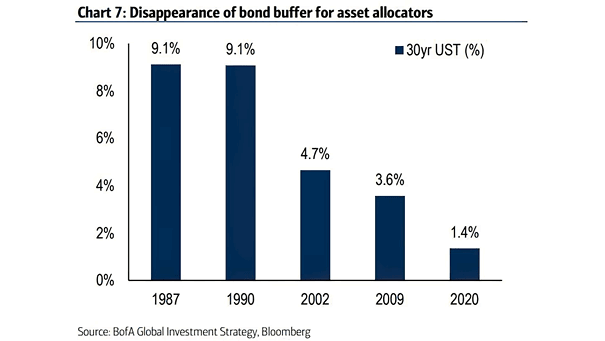
U.S. 30-Year Treasury Yield and Asset Allocation In a low yield environment, does a 40% bond allocation still make sense? Image: BofA Global Investment Strategy
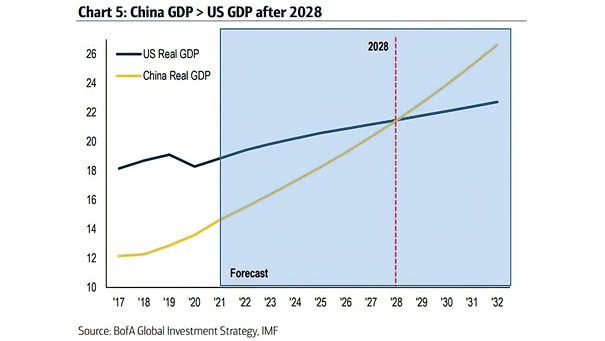
China Real GDP vs. U.S. Real GDP Chart suggesting that China real GDP will overtake U.S. real GDP after 2028. Image: BofA Global Investment Strategy